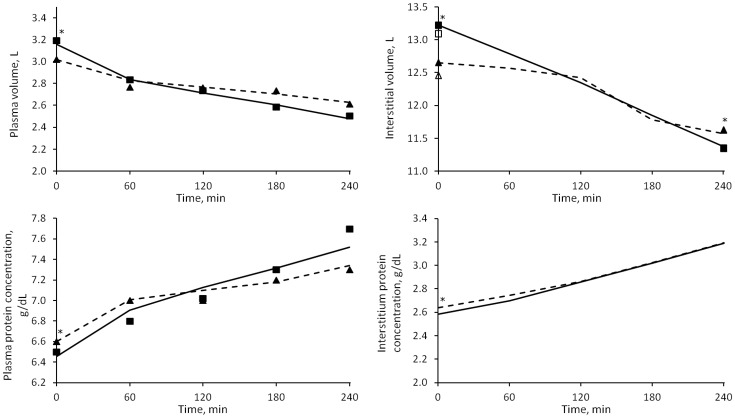
Fig 2. Median values of the solutions of the model (Vp, Vi, Cp, Ci).
HD1 (continuous line) and HD3 (dashed line). Squares: HD1 data; triangles: HD3 data. Empty squares and triangles represent the original, unadjusted initial values of interstitial volume (see Methods section). * = p < 0.05 for HD1 vs. HD3.

