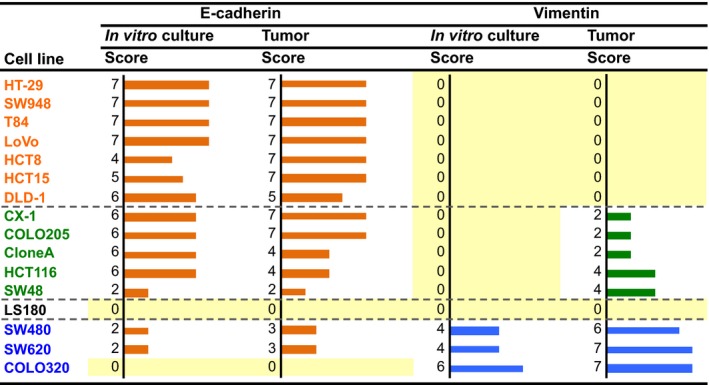
Figure 2.

Immunostaining scores for expression of E‐cadherin and vimentin in cultured colorectal cancer cells in vitro and the orthotopically implanted tumors. Staining intensity was scored as 0 (negative), 1 (weak), 2 (medium), or 3 (strong). The extent of staining was scored as 0 (0%), 1 (1–25%), 2 (26–50%), 3 (51–75%), or 4 (76–100%) according to the proportion of positively stained areas in relation to the area of the whole tumor. The sum of the intensity and extent scores was used as the final staining score (0–7) for each specimen. Names of the cell lines were represented using three colors to discriminate their phenotypic belongings shown in Fig.3, 15
