
Figure 6.
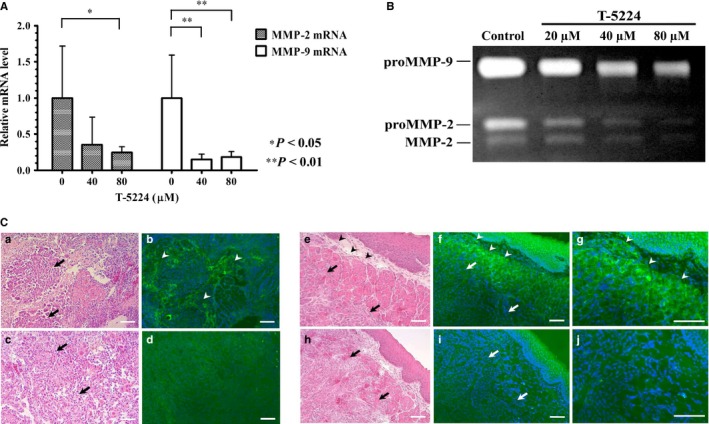
Effect of T‐5224 on the transcription and activity of MMP‐2 and ‐9. (A) T‐5224 suppressed the transcription levels of MMP‐2 and ‐9 mRNA in HSC‐3‐M3 head and neck squamous cell carcinoma cells. β‐Actin mRNA was used as an internal control. Data represent the mRNA levels of MMP‐2 and ‐9 incubated with 0, 40, and 80 μM T‐5224 relative to those in the control group. Data represent mean ± SD (n = 3). *Statistically significant differences from the controls are shown (P < 0.05), **Statistically significant differences from the control are shown (P < 0.01). (B) Gelatinolytic activity, which reflects the activity of MMP‐2 and ‐9, was quantified by gelatin zymography. HSC‐3‐M3 cells were incubated in dishes with different concentrations of T‐5224 (0, 20, 40, and 80 μM) for 24 h, and the supernatant of each medium was collected and electrophoresed. Relative density of MMPs at 20, 40 and 80 μM expressed as ratio of control was 0.85 ± 0.11, 0.43 ± 0.10, and 0.20 ± 0.03 for MMP‐2, and 0.72 ± 0.06, 0.47 ± 0.09, and 0.36 ± 0.07 for MMP‐9, respectively. The gelatinolytic activity of MMP‐2 and ‐9 was significantly suppressed by T‐5224. (C) To identify the localization of activated MMP‐2 and ‐9 in the tumor sites, in situ gelatin zymography was carried out using unfixed cryostat sections of orthotopically implanted tongue tumors. Green fluorescence corresponds to the gelatinolytic activity of MMP‐2 and ‐9. Images (a–d) are tangential sections of the tip of the tumor; images (e–j) are tumor center cross‐sections showing their tumor edge. The intensity of green fluorescence was compared between the control (a,b,e–g) and T‐5224‐treated groups (c,d,h–j). MMP activity was upregulated in the stromal tissue (arrowhead) close to the tumor cells (arrow) in the control groups, and was attenuated in the T‐5224‐treated groups. Scale bar = 100 μm.