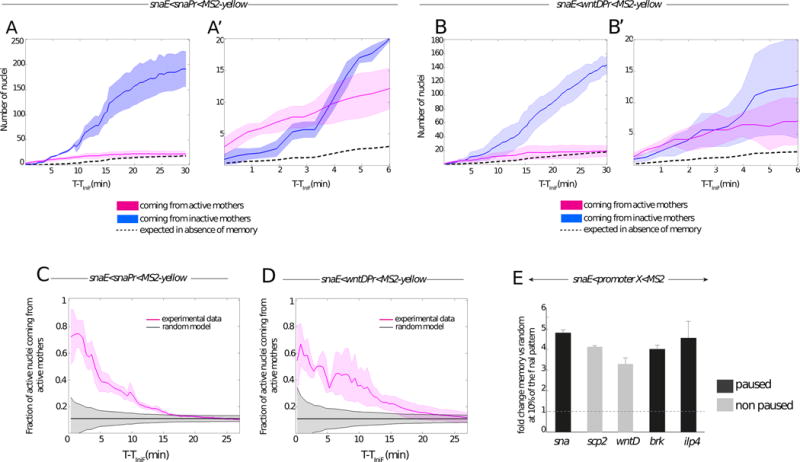
Figure 2. Quantitative analysis of transcriptional memory.

(A–B) Memory bias in transcriptional activity during cc14. Kinetics are extracted from 3 independent movies of snaE<snaPr<MS2 transgenic embryos (A) and from 3 independent movies of snaE<wntDPr<MS2 transgenic embryos (B). The distribution of active nuclei derived from transcriptionally active mother nuclei is shown in pink. The descendants of inactive mother nuclei are depicted in blue. Light colors indicate the standard deviation of these quantified kinetics. Dashed curves represent the expected average time behavior in the absence of a memory bias, for mathematical formulations please refer to the main text. (A′, B′) Zoomed view of the 6 first minutes of cc14, corresponding to the plots shown in (A) and (B) respectively.
(C, D) Temporal behavior of the fraction of nuclei derived from memory mothers during cc14 (pink curves). Two different genotypes are shown, with a paused promoter (snaE<snaPr<MS2, n=3) (C) or a non-paused promoter (snaE<wntDPr<MS2, n=3) (D). Experimental data are compared to the expected behavior of a random activation distribution, indicated in grey, assuming a binomial sampling of a constant fraction of active nuclei in each cell cycle (see Supplements for details). For all the plots (A to D) the x axes corresponds to the time (in minutes), starting at the frame where the first spot is detected (TiniF). (E) Increase in the probability that a memory daughter nucleus is among the first cohort (first 10%) of activated nuclei with respect to the random model expectations during the onset of cc14 for the following transgenes: snaE<snaPr<MS2 (n=3 movies); snaE<wntDPr<MS2 (n=3 movies), snaE<scpPr<MS2 (n=2movies), snaE<brkPr<MS2 (n=2movies), snaE<ilp4Pr<MS2 (n=2 movies). The fold change is obtained by dividing the fraction of active nuclei coming from active mothers by the fraction expected from the random model. The fold change is evaluated at the time corresponding to 10% of the total active pattern. Error bars represent standard errors. See also Figure S2 and Movie S2.
