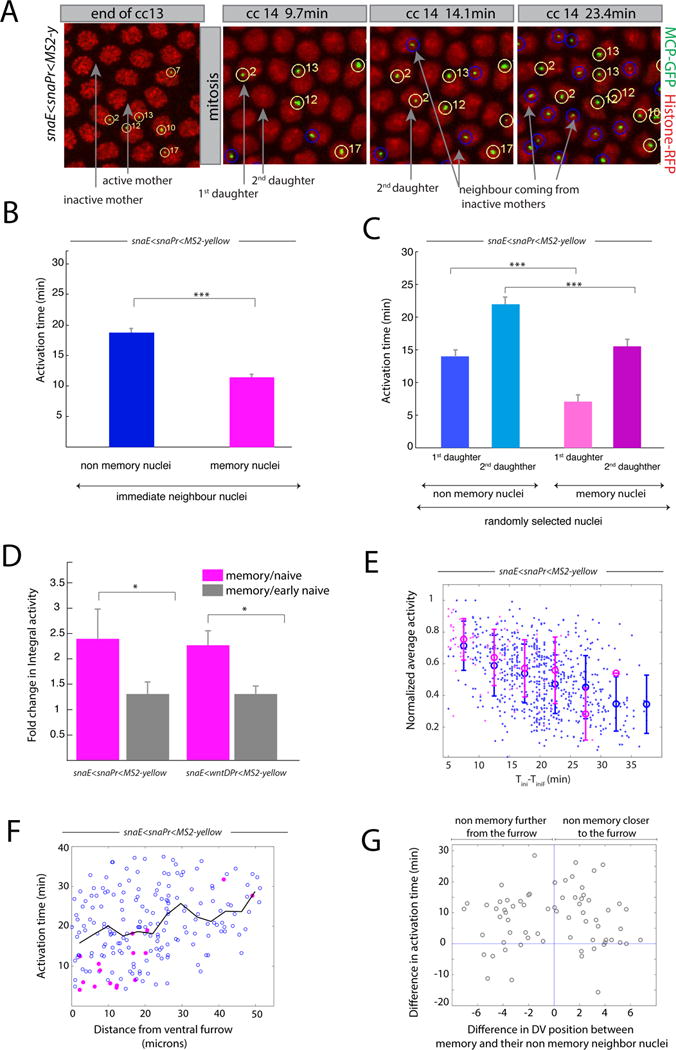
Figure 3. Transcriptional kinetics of memory.

(A) Snapshots of live imaging of a snaE<snaPr<MS2 transgenic embryo. Confocal z-projected images of selected ventral regions are shown at different time points during cc13 and cc14. Tracked active nuclei at cc13 and their descendants (first and second daughter to exhibit transcription) are circled and numbered in yellow. Examples of immediate neighboring nuclei coming from inactive mother nuclei are circled in blue. (B) Mean activation time for descendants of active mother nuclei and for immediate neighboring nuclei coming from inactive mothers. Error bars represent standard errors (non-memory nuclei are shown in blue, n=68; memory nuclei are shown in pink, n=68; memory versus non-memory p-value=3*10−10). (C) Mean activation time for descendants of active mother nuclei or those from inactive mothers, tracking the first daughter and second daughter separately, randomly selected from the entire imaged region. For panels B, C, quantification was performed on 3 movies of snaE<snaPr<MS2 transgenic embryos (total of 750 nuclei). Error bars represent standard errors (first daughter non memory, n=54; second daughter non memory, n=54; first daughter memory, n=24; second daughter non memory n=24). Statistics: first daughter non memory versus first daughter memory, p-value= 3*10−8; second daughter non memory versus second daughter memory, p-value=1*10−4). (D) Fold change in integral activity, defined as the ratio between the integral activity of memory nuclei divided by that of non memory nuclei. Integral activity corresponds to the sum of activities across all time frames. Error bars represent standard errors computed on 3 different movies for each genotype. Statistics: snaE<snaPr<MS2 p-value=0.02; snaE<wntDPr<MS2 p-value=0.03). (E) This scatter plot shows the behavior of the average activity as a function of the activation time. The data points are extracted from three movies and the value of the average activity is normalized by its maximum. Nuclei coming from active mothers are depicted in pink while those coming from inactive mothers are represented in blue. Error bars are standard deviations evaluated by binning the activation time in intervals of 5 minutes each. (F) Scatter plot of the activation time as function of the distance from the ventral furrow at cc14 for a snaE<snaPr<MS2 transgenic embryo. Pink symbols represent memory nuclei and blue symbols non memory ones. The black line is the average behavior. (G) Scatter plot of the difference in activation time between a memory nucleus and its non memory closest neighbor as function of their distance. The statistical test used in Figure 3 is a two samples t-test with the following convention: * for a p-value comprised between 0.05 and 0.01; ** for a p-value comprised between 0.01 and 0.001; *** for a p-value inferior or equal to 0.001. See also Figure S3, Movie S2 and Movie S3.
