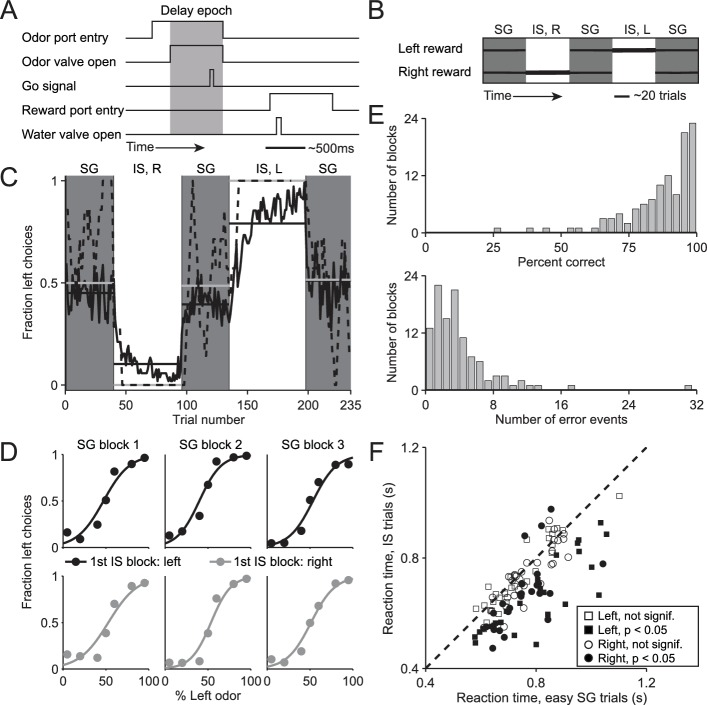
Figure 1. Behavioral task and performance.
(A) Timing of events in each trial. The mouse enters the odor port, receives an odor mixture, waits for the go signal, exits the odor port, moves to one of the reward ports, and receives a water reward for a correct choice. Gray box, delay epoch. (B) Organization of SG (gray) and IS (white) blocks within a session. All sessions start with an SG block and alternate between SG and IS blocks. In SG blocks, reward side corresponds to the dominant odor in the mixture [(-)-carvone, left; (+)-carvone, right]; when the odors are balanced ([(-)-carvone] = [(+)-carvone]), the probability of reward at both reward ports is 0.5. In IS blocks, odors are balanced in every trial and reward is available at the same side in each trial. Thickness of horizontal lines corresponds to probability of reward. SG, stimulus guided; IS, internally specified; L, left; R, right. (C) Fraction of left choices across block types throughout the session. Dashed line shows an example session (boxcar smoothed over 7 trials), solid black line shows mean over all sessions (54, from 4 mice), horizontal black lines show block means, horizontal gray lines show ideal block means (if all choices were correct). To account for different numbers of trials per block across sessions, trials that occur in < 60% of sessions are excluded. In SG blocks only difficult trials [(+)-carvone/(-)-carvone = 60/40, 50/50, or 40/60] are shown. (D) Mean performance in SG blocks over all sessions, separated by rewarded side of first IS block in the session. Lines show best fit to , where x is the proportion of the left odor [(-)-carvone)] in the mixture, p is the fraction of right choices, and a and b are free parameters. While choices were slightly biased by the rewarded direction in the first IS block (center panels), they were much more strongly influenced by the stimulus. (E) Performance in IS blocks. Histograms of percent correct choices (top) and number of error events (run of consecutive incorrect choices, bottom) across blocks over all sessions. (F) Mean reaction time in easy SG trials plotted against mean reaction time in IS trials in the corresponding session, separately for each direction of movement.

