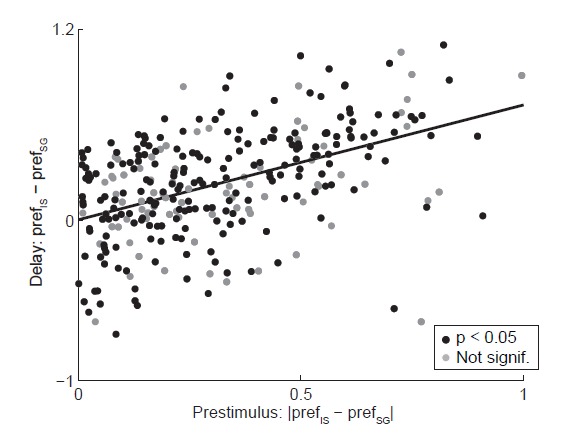
Author response image 3. Relationship between activity during prestimulus and delay epochs.

Abscissa shows the absolute value of the difference in strength of direction preference between SG and IS trials during the delay epoch, where the sign preserves the relationship between preference in SG and IS trials across epochs (e.g., if prefSG > prefIS in the prestimulus epoch, ordinate shows prefSG – prefIS). Black circles show neurons with a significant direction preference (corresponding to black bars in Figure 3C; gray circles show neurons without significant direction preference (corresponding to gray bars in Figure 3C. See response to Comment #14.
