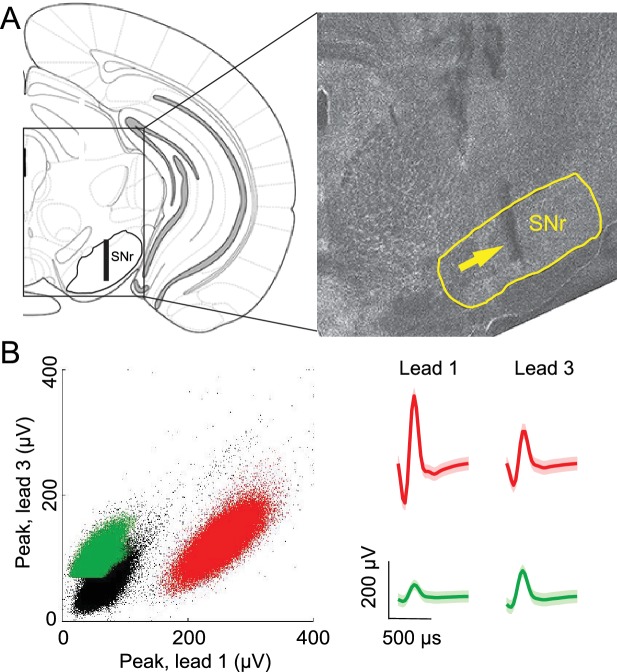
Figure 2. Confirmation of recording sites and spike clustering.
(A) Schematic (left) shows targeted recording extent (bar) within SNr; coronal section (right, 3.3 mm caudal from bregma) shows representative tetrode track (arrow) in SNr. (B) Left, peaks of waveforms from lead 1 plotted against peaks of waveforms from lead 3 of one tetrode for a representative recording session. Note that clustering was performed using additional features to those shown here. Red and green points show waveform peaks recorded from neurons considered to be distinct. Right, waveforms (mean ± SD) corresponding to red and green points.

