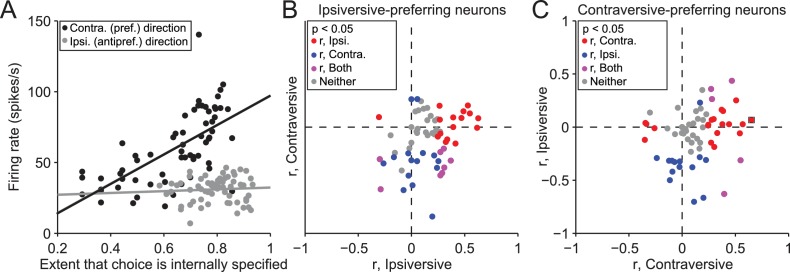
Figure 4. Activity depends on the extent to which movements are internally specified.
(A) Firing rate during delay epoch plotted as a function of the value of the rewarded side, estimated via reinforcement learning (), for both IS blocks in a session, for one example neuron. Each circle corresponds to one trial. (B) Correlations (as in panel A) for ipsiversive movement plotted against contraversive movement, for the population of ipsiversive-preferring neurons (left black bars in Figure 3C) with activity that depended on trial type (SG vs. IS). Each circle corresponds to one neuron. (C) Same as B, for contraversive-preferring neurons (right black bars in Figure 3C). Black box corresponds to example neuron from A.

