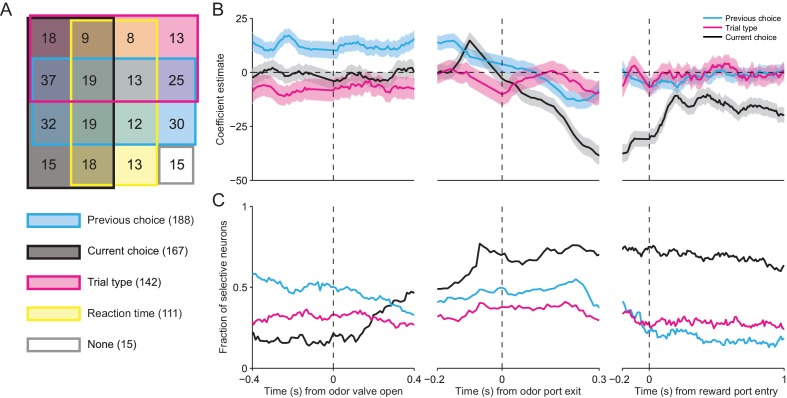
Figure 6. SNr activity is influenced by several task-relevant factors throughout the trial.
(A) Venn diagram showing the number of neurons whose firing rate during the delay epoch was significantly influenced (p < 0.05) by previous choice, current choice, trial type, reaction time, and all combinations of these factors, or by no factor. (B) β coefficients estimated based on firing rate in 100 ms bins aligned to three different trial events for one example neuron (reaction time coefficient not shown, for clarity). Shading, ± 95% confidence interval. (C) Fraction of neurons with a significant β coefficient corresponding to each predictor variable in each 100 ms bin, aligned as in panel B. All 296 neurons were included in this analysis.

