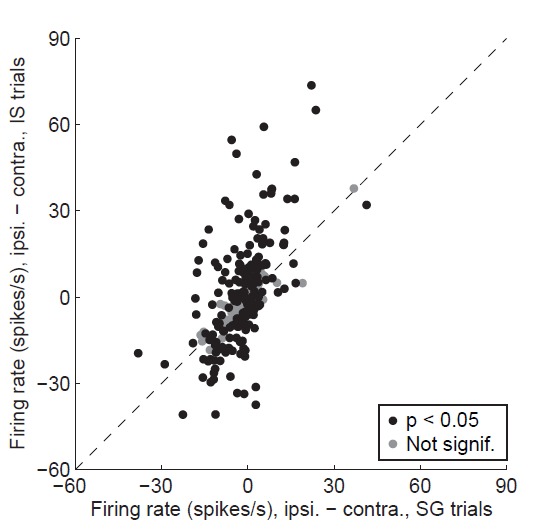
Author response image 1. Alternative display for Revised Figure 3D.

Difference in delay-epoch firing rate between ipsiversive and contraversive trials in stimulus-guided vs. internally-specified trials in the corresponding session. Black circles show neurons with a significant direction preference (corresponding to black bars in Figure 3C; gray circles show neurons without a significant direction preference (corresponding to gray bars in Figure 3C. Only correct trials are included; all choices on 50/50 SG trials were considered correct regardless of whether they were rewarded (as in Figure 3D). We believe that this display is not as informative as Revised Figure 3D (see response to Comment #9).
