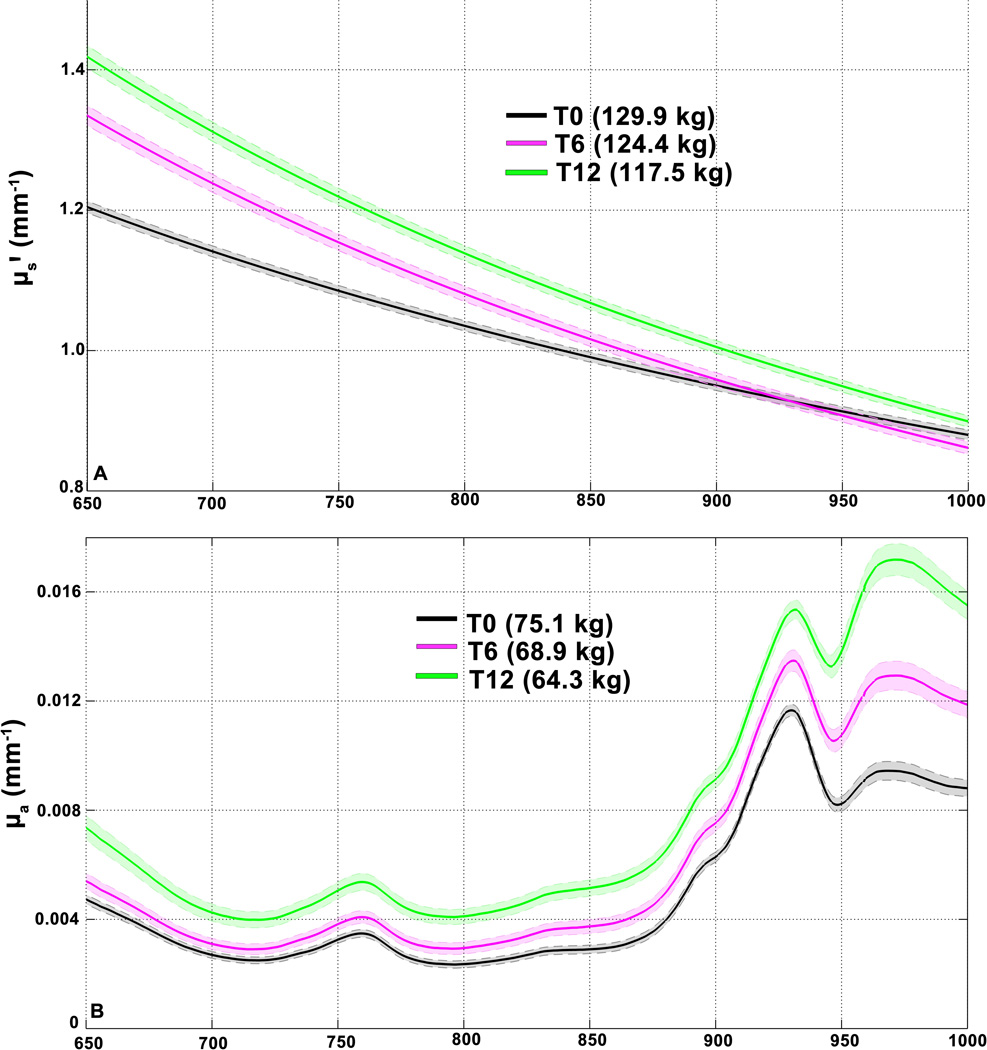
Figure 2. Individual subject DOSI maps.
Serial images of DOSI parameters in one male subject overlayed on 3-D images of a representative abdomen. Corresponding measured weight at each respective time point is also shown. (A) shows serial images of μs' A parameter, (B) shows μs' b, (C) shows tissue water fraction, and (D) shows [HbR]. Heat maps have been overlayed onto a representative 3D abdominal image for visualization only, and these do not represent subject abdominal shape or contour.

