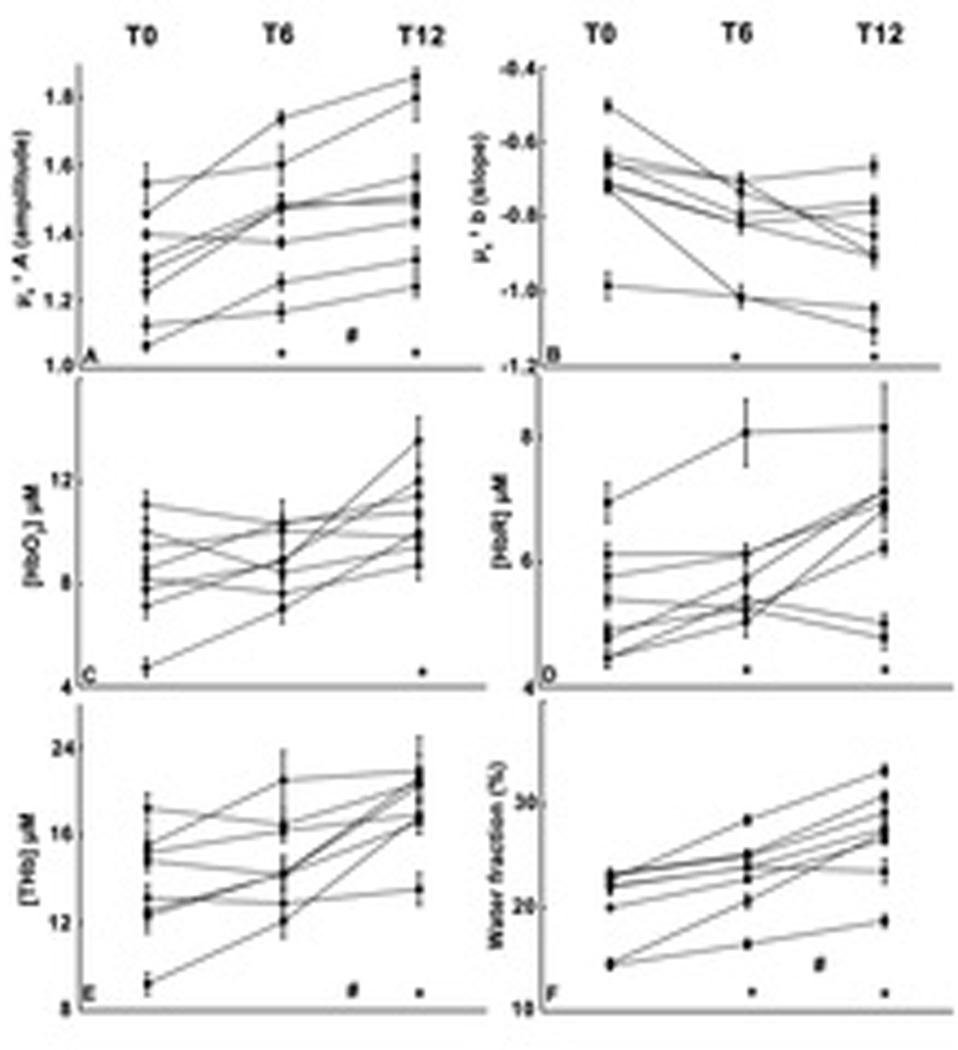
Figure 4. Mean optical parameter values.

Individual subject profiles of scattering and absorption derived parameters for all 10 subjects at three time points. (A) and (B) panels are A and b scattering parameters, respectively. (C) is [HbO2], (D) is [HbR], (E) [THb], (F) water fraction, with units indicated on respective Y axes. Each individual point represents the mean of all measurement locations obtained, and error bars are standard errors for all measurement points obtained. * symbol indicates a significant difference in mean value for all participants from T0 level, whereas # indicates a significant difference between T6 and T12.
