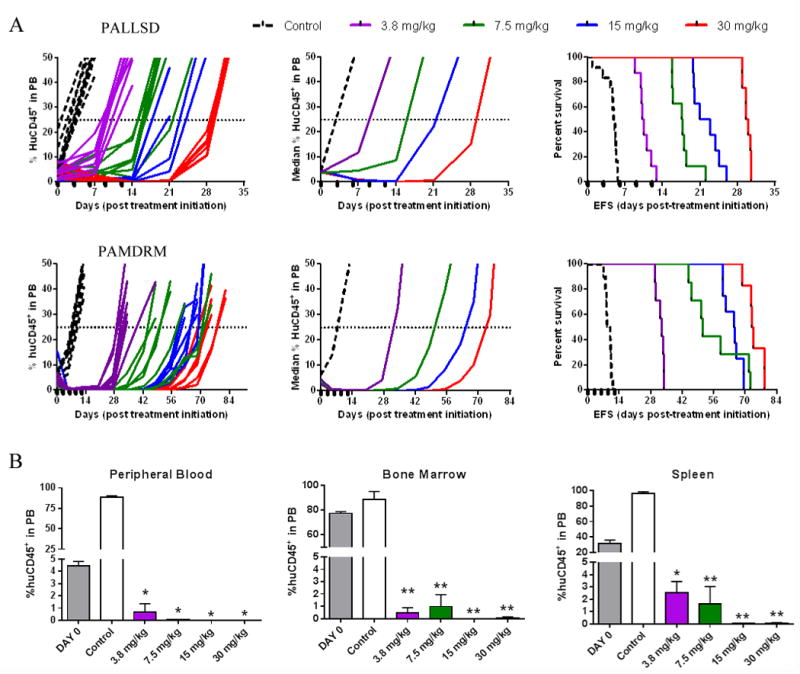
Figure 3. Birinapant exhibits in vivo efficacy over a broad dose range.

(A) individual and median (left and middle panels) %huCD45+ cells in the peripheral blood of mice and Kaplan–Meier curves for EFS (right panels) for 2 Ph-like BCP-ALL PDXs, PALLSD and PAMDRM. Black boxes on the x-axis indicate treatment days. (B) Assessment of disease dissemination in the peripheral blood, bone marrow and spleen of the Ph-like xenograft PAMDRM, 14 days post treatment initiation. Data represent the mean ± SEM, n ≥ 3 mice/ group. *P<0.05, **P<0.001, Student's t-test.
