
Figure 5. Generation of a birinapant sensitivity gene expression signature.
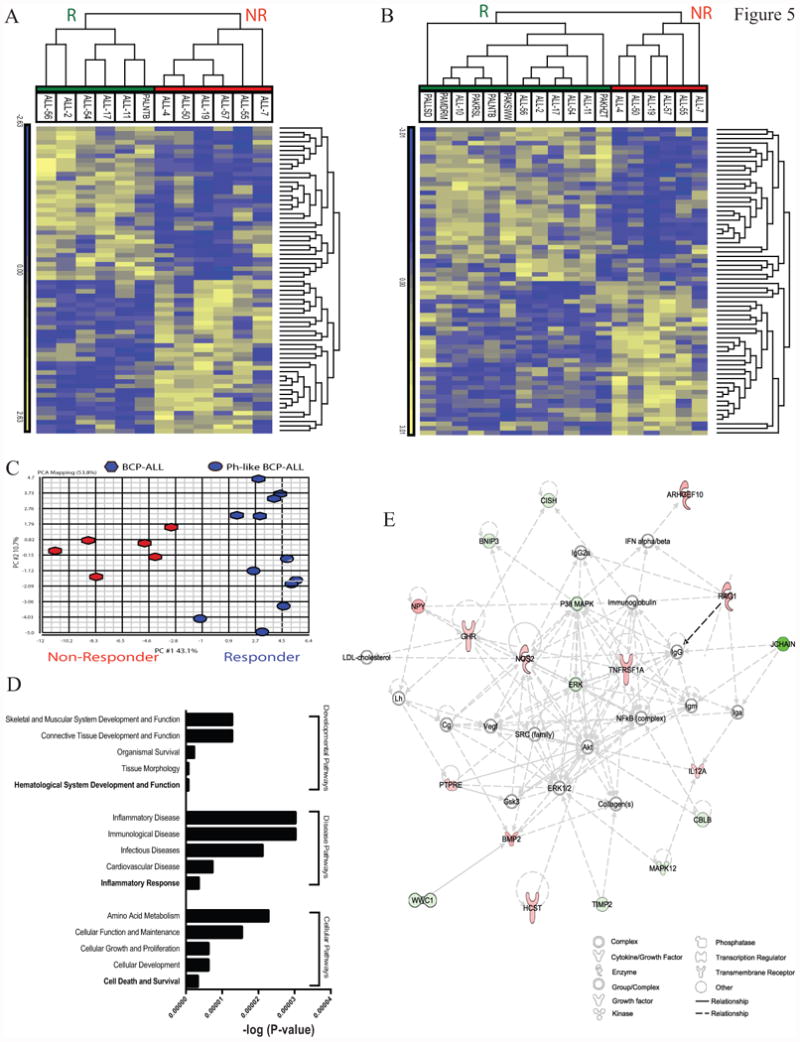
(A) hierarchical clustering of 12 BCP-ALL PDX samples (columns), based on the pre-treatment expression levels of the Birinapant-signature genes (rows), grouped as Responders (green) or Non-Responders (red). (B) hierarchical clustering of the same 12 PDXs plus an additional 6 Ph-like PDXs showing that the Birinapant-signature was maintained in Ph-like ALL Responders. (C) Principal Component Analysis of the same samples identified that the first principal component was sufficient to separate Responders (blue) from Non-Responders (red). (D) IPA of the birinapant-signature identified the most enriched pathways associated with Developmental, Diseases and Cellular expressed as –log(P-value). (E) Network analysis (IPA) of the birinapant-signature using the organic layout algorithm identified a network centered on TNFR1.