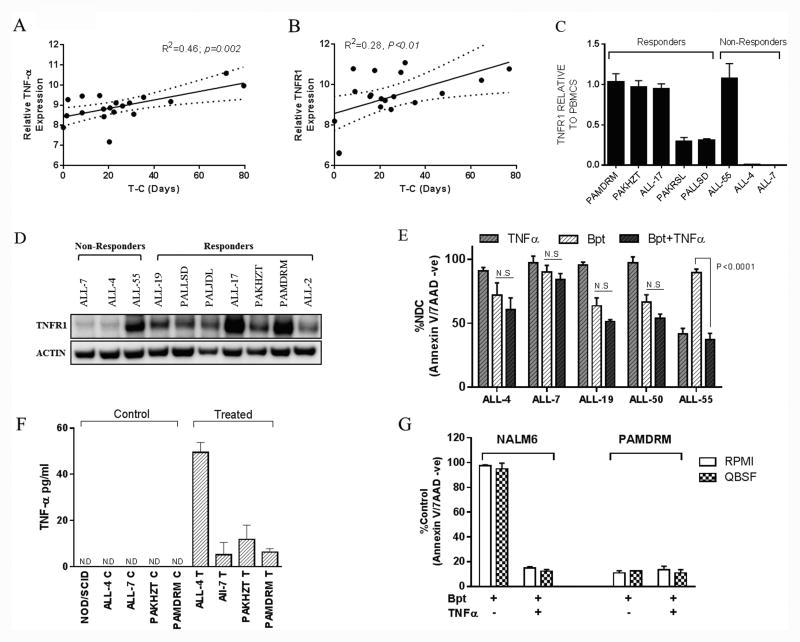
Figure 6. Expression levels of TNFα and related genes in BCP-ALL PDXs and their correlation with in vivo birinapant response.
(A) and (B) correlation between TNFα (A) and TNFR1 (B) gene expression and in vivo sensitivity (T-C) for 19 BCP-ALL PDXs. Regression line and 95% confidence intervals are shown. (C) mRNA expression of TNFR1 by RT-PCR for 8 xenografts. Results are expressed as fold change relative to normal PBMNCs. (D) Western blot analysis of TNFR1 protein levels. (E) Resistant xenografts were treated with birinapant ± 10 ng/ml TNFα. Viability was assessed after 24 h using annexin V 7AAD staining. (F) TNFα protein levels in the plasma of control and birinapant treated mice as quantified by ELISA, ND (not detectable). (G) NALM6 and PAMDRM cells treated in vitro with birinapant ± exogenous TNFα (10 ng/ml) in either RMPI1640 or QBSF-60 based media. Viability is expressed as a percent of untreated controls. Data represent the mean ± SEM from ≥ 3 independent experiments.

