
Figure 1.
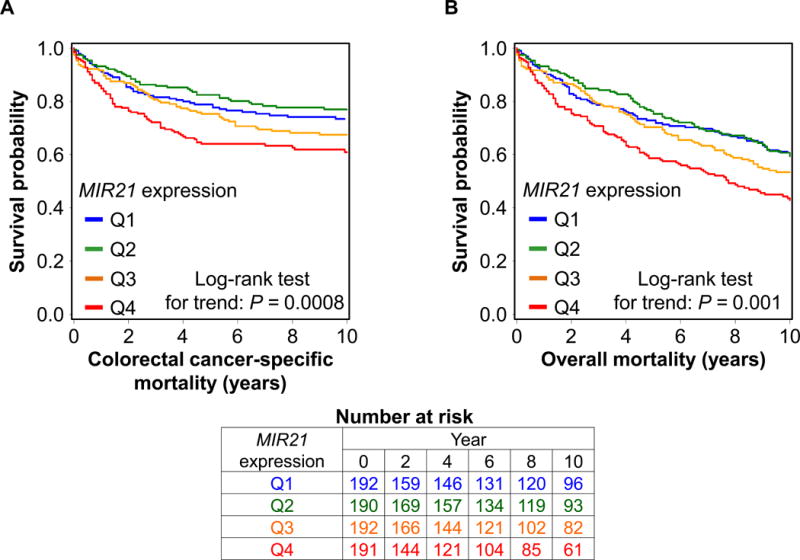
Kaplan-Meier curves for colorectal cancer-specific mortality (A) and overall mortality (B) according to tumor MIR21 expression level. P values were calculated by the log-rank test for trend (two-sided). The tables (bottom) show the number of patients who remained alive and at risk of death at each time point after the diagnosis of colorectal cancer. Q1 to Q4, quartile 1 to quartile 4.