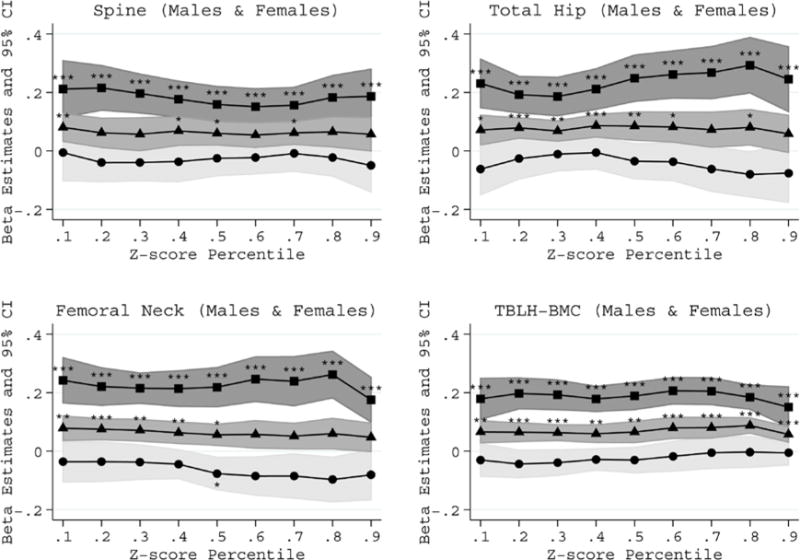
Figure 1.

Physical activity associations with bone Z-score percentiles in males and females combined. The associations for total (triangles), high impact (squares) and low impact (circles) physical activity are presented. The percentiles were modeled using longitudinal quantile regression to represent below average (<50th percentile), average (50th percentile) and above average (>50th percentile) bone Z-scores. The models were puberty stage, body mass index Z-score and genetic risk score. The percentile specific estimates and 95% confidence intervals represent the change in Z-score for each 1-hour per day increase in physical activity. The estimates statistically different from zero are indicated: *P≤0.01, **P≤0.001 and ***P≤1.0×10⁻⁴.
