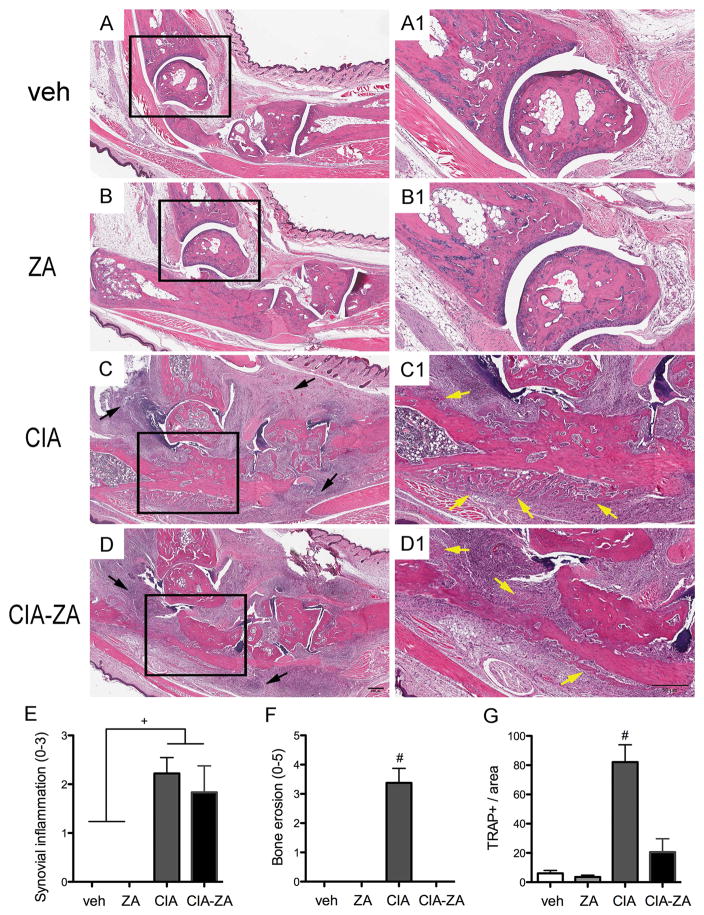
Figure 6. Histopathologic effects of ZA treatment in the hind paws and TRAP + cells staining.
Total ankle joints were isolated for histopathologic analysis (n = 6 mice per group). (A–D) Sagittal sections of the vehicle, ZA, CIA and CIA-ZA, respectively. Original magnification, x5. (A1–D1) Magnified views of the area represented by the black squares. Original magnification, x10. Black arrows point to inflammatory infiltration. Yellow arrows point to periosteal bone formation. (E–F) Quantification of the histopathologic findings in the ankle: Synovial inflammation, and bone erosions were measured in all groups at the end of the treatment. (G) Quantification of the TRAP+ cells number in all mice and groups. # Statistically significant different compared to all the other groups, p < 0.0001. + Statistically significant different from indicated groups, p < 0.0001. Differences among groups were calculated by two-way ANOVA and between groups by Student’s t test. Data represent the mean ± SEM.

