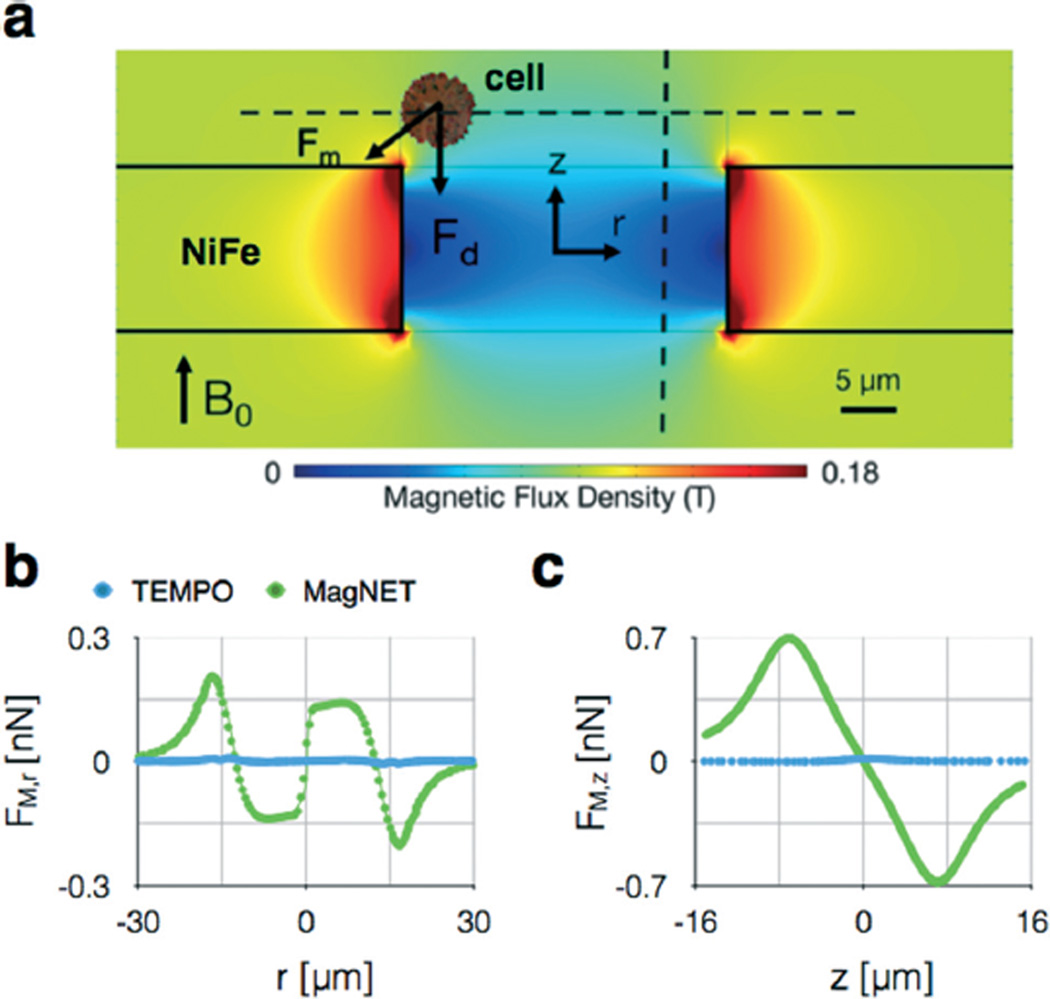
Fig. 3.
Finite element simulations of MagNET. a. The field strength |B| is plotted on the cross-section of an individual 30 µm pore. The magnetophoretic force Fm competes with drag force Fd to trap cells at the edge of the pore. b. The magnetophoretic force in the radial direction FM,r is plotted along r, one cell radius a = 5 µm above the MagNET's surface. c. The magnetophoretic force in the cylindrical direction FM,z is plotted along z, one cell radius a = 5 µm away the MagNET's edge.

