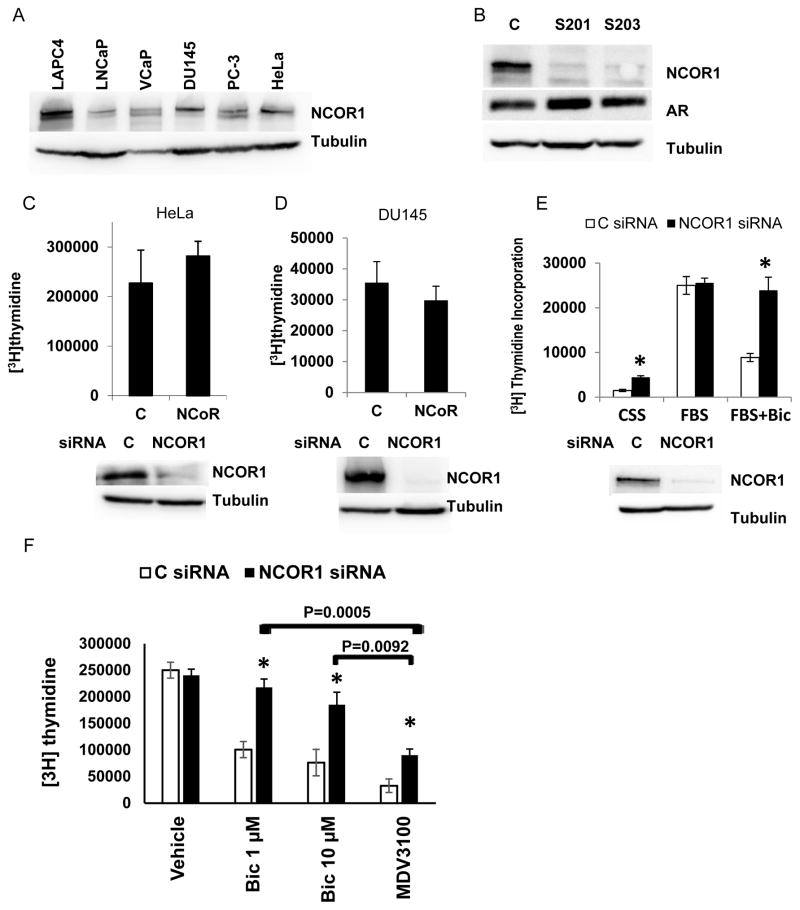
Figure 1. NCOR1 suppresses proliferation of LNCaP cells in css supplemented medium and in the presence of bicalutamide.
A. Fifty microgram of protein extracted from LAPC4, LNCaP, VCaP, DU145, PC-3, and HeLa cells were resolved on SDS PAGE and analyzed for NCOR1 and tubulin expression. B. LNCaP cells were transfected with control (C) or two independent NCOR1 specific siRNAs (s201, s203). Cells were harvested 48 hours later and analyzed for NCOR1, AR, and tubulin expression by Western blot analysis. C. HeLa cells were transfected with either control or NCOR1 specific siRNA and cells were grown for 48 hours in complete medium. DNA synthesis was compared by measuring rates of [3H] thymidine incorporation. Cells transfected in parallel were analyzed for levels of NCOR1 by western blotting. D. DU145 cells were transfected and analyzed exactly as in C. E. LNCaP cells were transfected with control or NCOR1 specific siRNA and grown for 24 hours in medium supplemented with css or FBS serum as indicated. Cells were then treated for 24 hours with either vehicle (ethanol) or 1 μM bicalutamide and [3H] thymidine incorporation measured. Cells transfected in parallel and treated with vehicle were analyzed for NCOR1 and tubulin expression by Western blot analysis. F. LNCaP cells were transfected with either Control or NCOR1 specific siRNA and 24 hours later treated with either vehicle (ethanol), 1 μM bicalutamide, 10 μM bicalutamide, or 10 μM MDV3100 for additional 24 hours. In panels B through F experiments were repeated at least three times with two different NCOR1 specific siRNAs. Each point in DNA synthesis assay was done in triplicates. Average and standard deviations are shown. Unless the exact value is shown, * denotes differences between control and NCOR1 siRNA transfected cell with p < 0.05

