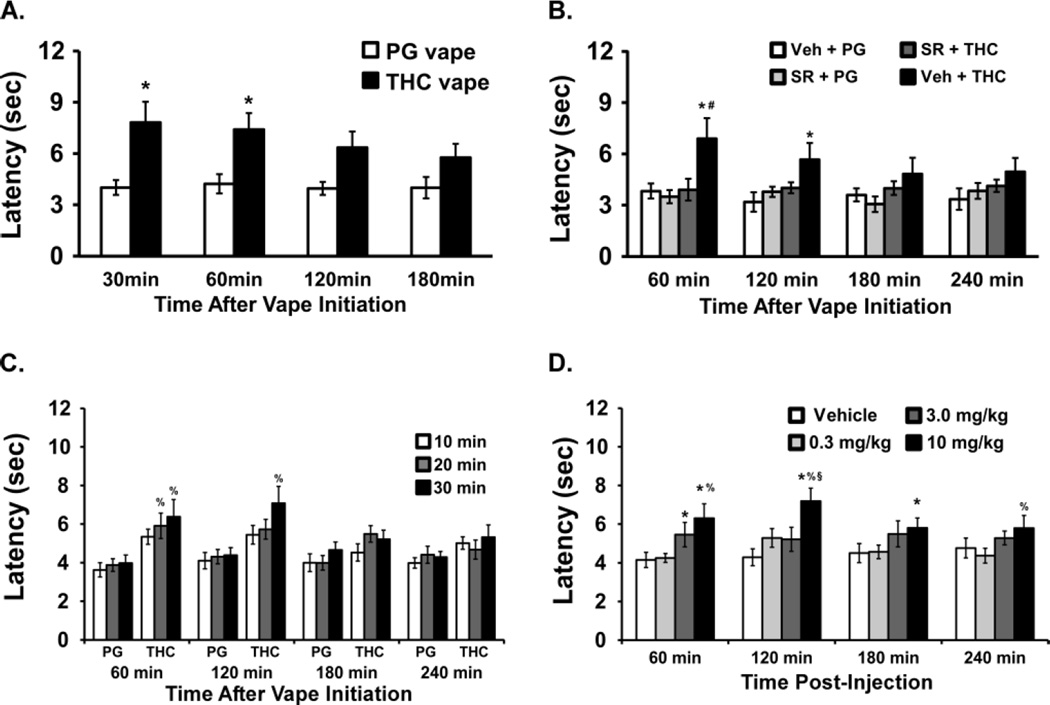
Figure 4.
Mean tail-flick latency measured following A) 20 min of PG or THC exposure (N=14); B) 20 min of exposure with pre-treatment with SR141716 (SR; 4 mg/kg, i.p.) or Vehicle (N=8); C) 10, 20 or 30 min of PG or THC exposure (N=14); D) Injection of THC (N=10; 0.3–10 mg/kg, i.p.) Significant differences compared with respective vehicle condition are indicated by *, differences from SR+THC vapor by #, from the lowest dose (10 min or 0.3 mg/kg) by % and from the 3.0 mg/kg dose by §.

