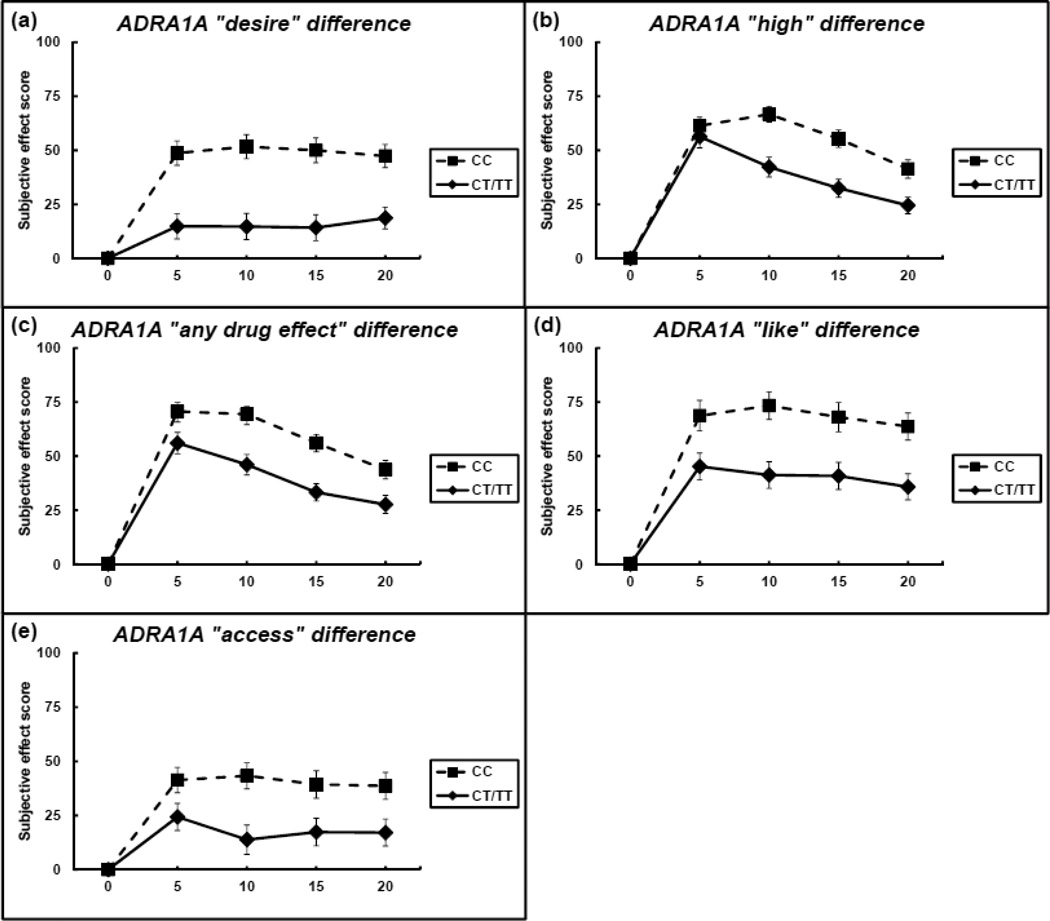
Figure 1. Subjective effect scores by ADRA1A rs1048101 genotype.
Subjective effect scores for ‘desire’ (panel A), ‘high’ (panel B), ‘any drug effect’ (panel C), ‘like’ (panel D), and ‘access’ (panel E) are shown for each time point starting with baseline at time zero. Scores for each time point in the CT/TT genotypes group (N = 35) are represented by the solid line, and time points for the CC genotype group (N = 30) are represented by the dashed line. Error bars indicate standard error of the mean.

