
Figure 8.
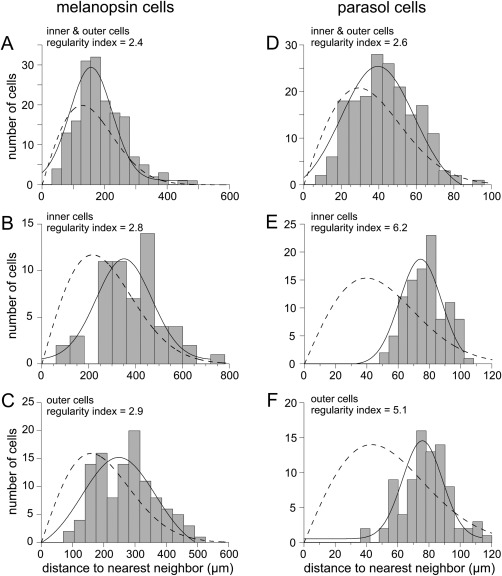
Spatial regularity of the macaque melanopsin cell mosaic. Nearest neighbor distances are plotted as histograms and fit with a Gaussian function (solid lines); dashed lines are predictions from probability theory for the cell density of the sample and a random distribution (Wässle and Riemann, 1978). A: Macaque inner and outer melanopsin cells plotted together (n = 171; mean density 9.8 cells/mm2). The regularity index (mean distance divided by 1 SD) was 2.4. B: Inner melanopsin cell distances plotted alone; regularity has increased to 2.8 (n = 59; mean density 3.4 cells/mm2). C: Outer melanopsin cells plotted alone; regularity index = 2.9 (n = 112; density 6.3 cells/mm2). D–F: Spatial regularity of macaque parasol cells in a 1‐mm2 sample area is shown for comparison. D: Plot of cell distances for inner and outer parasol cells together; regularity index = 2.6 (n = 187). E: Plot of inner cell distances only; regularity index = 6.2 (n = 102). F: Plot of outer cells only; regularity index = 5.1 (n = 85).