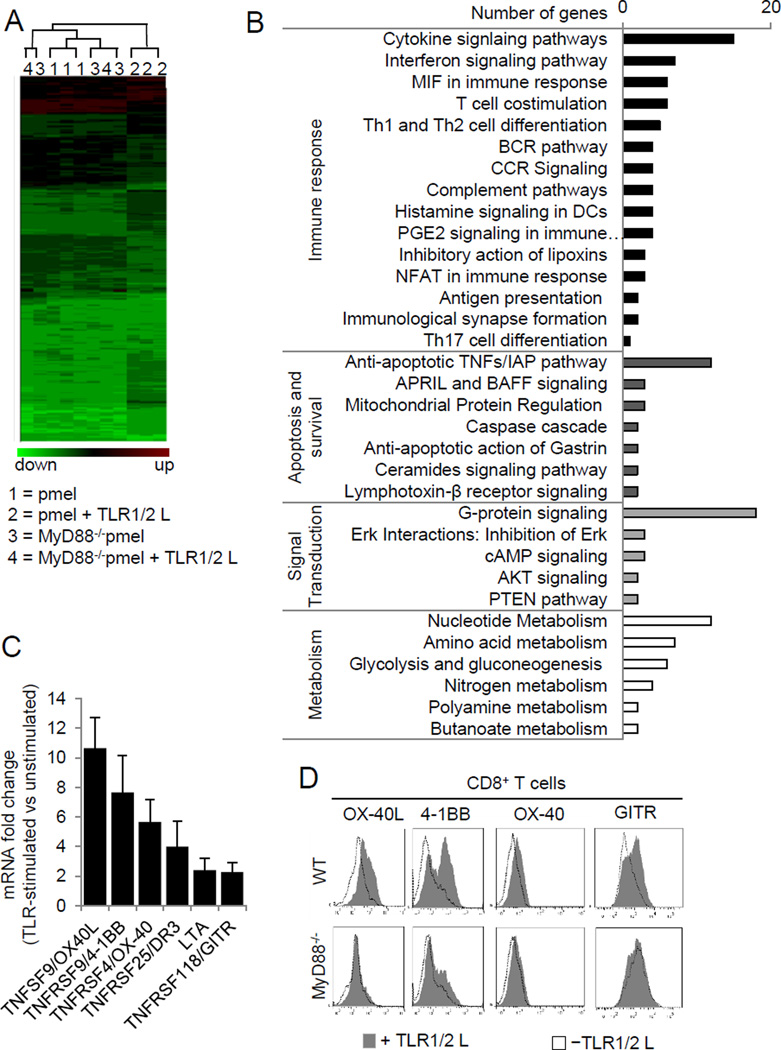
Figure 2. Gene expression analysis of TLR2-stimulated CD8+ T cells show an enhanced expression of TNFRSF members.
A, Gene expression analysis was conducted on purified CD8+ T cells from pmel and MyD88−/− pmel mice, activated with hgp10025–33–pulsed MyD88−/− APCs with or without TLR1–TLR2L for three days. Genes colored green are under-expressed, while red indicates over-expression. B, Classification of genes upregulated by TLR stimulation in panel (A). C, Changes in mRNA transcript levels between TLR-stimulated and non-TLR-stimulated (±s.d.) T cells were determined by real time PCR. D, Surface expression of TNFRSF members on WT and MyD88−/− CD8+ T cells 3 days after activation with anti-CD3ε in the presence or absence of TLR1–TLR2 ligand were confirmed by flow cytometric analysis. The data shown are representative of three independent experiments.

