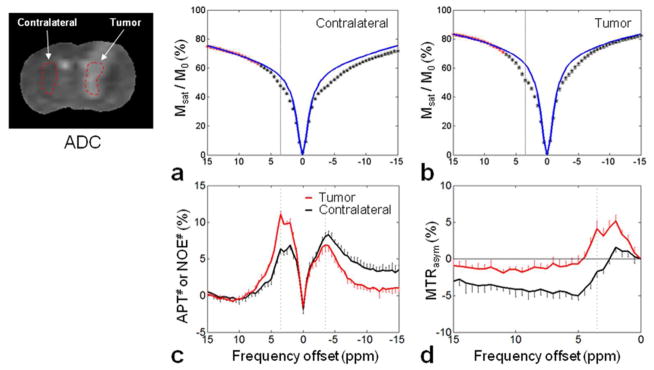
Fig. 2.
Experimentally acquired Z-spectra (black and red asterisks) and calculated ZEMR spectra (blue lines) for the contralateral (a) and the tumor (b) brain regions. For each ROI, the limited Z-spectrum dataset with positive, large frequency offsets (red asterisks) was used for the two-pool MT model fitting. Calculated APT#, NOE# (c) and MTRasym(3.5ppm) (d) signal features as a function of frequency offsets for the contralateral (black line) and the tumor (red line) regions. The APT# and NOE# results were obtained by subtracting the experimentally acquired Z-spectra from the corresponding calculated EMR spectra, and the MTRasym(3.5ppm) results were obtained by subtracting the experimental Z-spectra on the positive offset side from the experimental Z-spectra on the negative offset side. All spectra were represented with standard errors.

