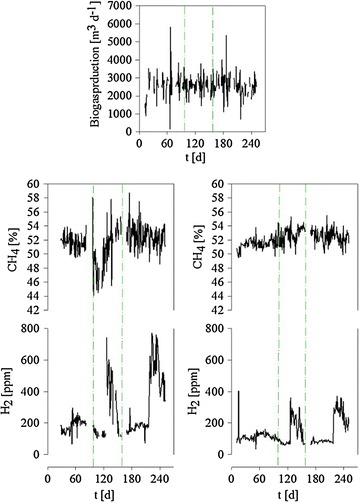
Fig. 1.

Biogas production over the observation period. Top Total biogas (no data available on the individual contributions of the fermenter and the post digester). Middle Methane content of the biogas from left fermenter and right post digester. Bottom H2-content of the biogas from left fermenter and right post digester. Dash-dotted lines mark feed changes. First line day 100, start of the addition of grass silage, second line day 160, start of the addition of ground wheat
