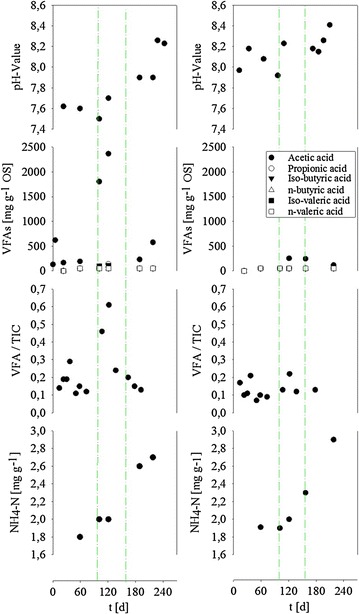
Fig. 2.

Development of abiotic process parameters over the observation period. From top to bottom pH-values, concentration of volatile fatty acids (VFA), VFA/TIC-values, ammonia-N-values in left fermenter and right post digester. Dash-dotted lines mark feed changes. First line day 100, start of the addition of grass silage, second line day 160, start of the addition of ground wheat
