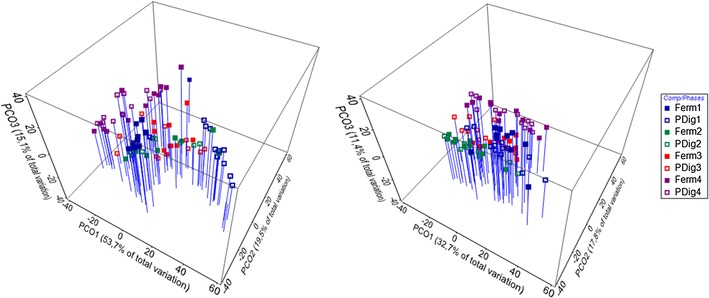
Fig. 3.

Principal coordinate analyses calculated from ARISA similarity matrices of methanogenic archaea (left) and eubacteria (right). The samples were assigned to a combination of compartments (fermenter, post digester) and time phases (I–IV): notable phase I (blue symbols days 0–14), phase II (green symbols days 23–58), phase III (red symbols days 73–137) and phase IV (pink symbols days 164–233). Filled symbols refer to fermenter (‘Ferm’) samples, open symbols to post digester (‘PDig’) samples. Blue lines facilitate vertical projection of the data points on the x, y plane
