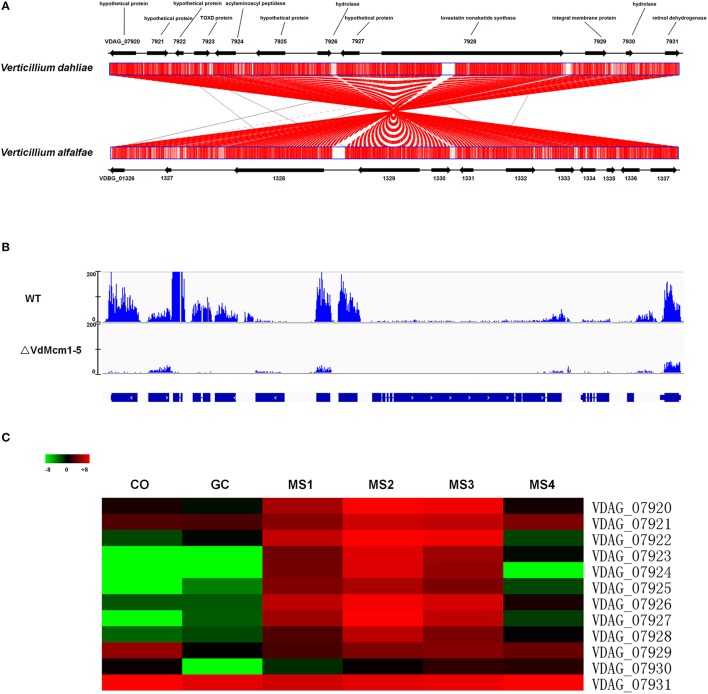
Figure 10.
VdMcm1 regulates genes expression of a secondary metabolism gene cluster. (A) Structure and gene annotation of the secondary metabolism gene cluster in V. dahliae and V. alfalfae. This gene cluster of V. dahliae showed high homology to that of V. alfalfae. Synteny was indicated by red lines. (B) Visualization of RNA-Seq coverage of this secondary metabolism gene cluster in wild-type strain and VdMcm1 deletion mutant. The blue curves indicated reads coverage. (C) Heatmap showing gene expression profiles of genes in the cluster during microsclerotia development. CO and GC represent conidia and conidia germination; MS1–MS4 represents four typical stages during the entire process of microsclerotia formation at 60, 72, 96 h, and 14 days. Log2(FPKM) value was used to draw the picture. Green color represented the negative value of Log2(FPKM), and red color represented the positive value of Log2(FPKM). Black color represented the zero value of Log2(FPKM).

