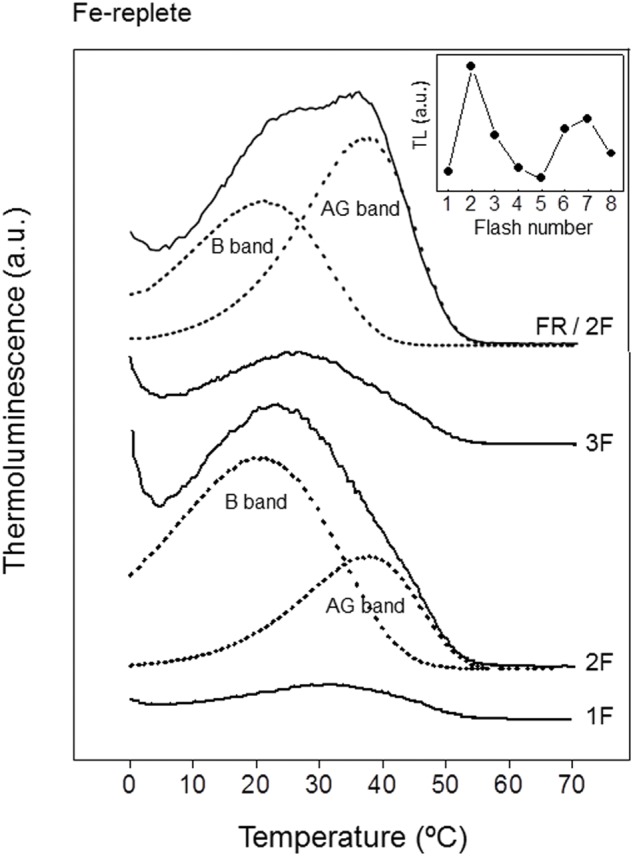
FIGURE 2.

Thermoluminescence glow curves of P. tricornutum cells from Fe-replete cultures. Typically, cell suspensions (equivalents to 15 μg Chl) from 21 days Fe-replete cultures were incubated in the darkness for 2 min at 20°C, then cooled to 1°C for 1 min and illuminated at the end of this period with different numbers of flashes of white light (1F, 2F, 3F) separated by 1 s. Luminescence emission was then recorded while warming samples from 1 to 80°C at a heating rate of 0.5°C s-1. In FR pre-illuminated experiments (FR/2F), before recording the luminescence emissions, FR light illuminations were applied through a optic fiber to cell suspensions using a tungsten lamp filtered through a 695 nm cut-off filter (4 μE m-2s-1 light intensity). The dashed lines represent the simulation components (B and AG bands) corresponding to the best fit obtained from the deconvolution software used (see Materials and Methods section). Inset: Oscillation of the intensity of B band as function of flash number. Intensities were obtained from the component analysis of the curves of TL. For further technical details see “Materials and Methods” section.
