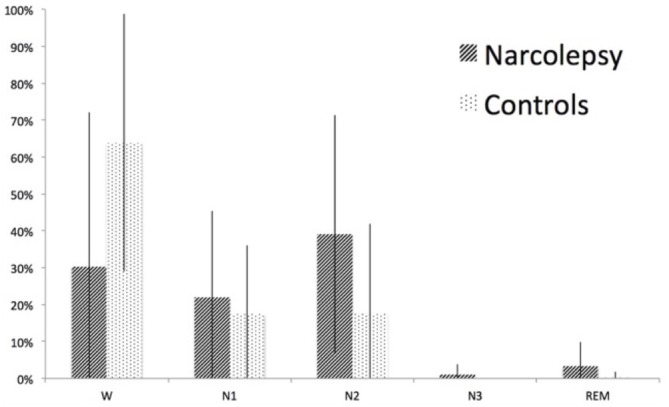
Figure 6.

Sleep stages during the fMRI-EEG examination. The figure shows percent time spent in wake (W), sleep stage 1 (N1), sleep stage 2 (N2), sleep stage 3 (N3), and rapid eye movement (REM) sleep for narcolepsy patients and controls, respectively. The error bars represent the standard deviation.
