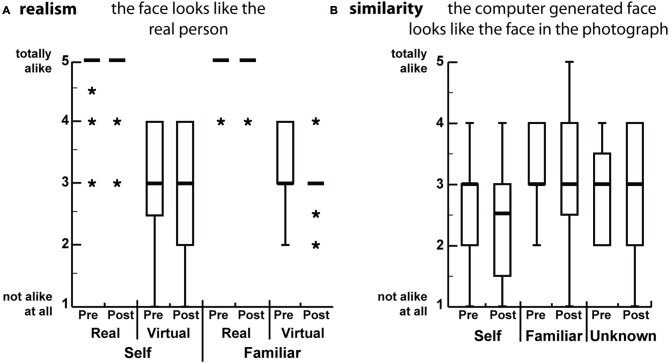
Figure 2.
Boxplots of the scores for the different faces, from the pre and post questionnaires. The scores range from 1 (not alike at all) to 5 (totally looks alike). Participants rated the faces by (A) Realism: they compared the pictures to the real person that they knew; (B) Similarity: they compared the real picture to the picture of the avatar face independently of whether they knew not the person in the picture. The thick horizontal bars are the medians and the boxes are the interquartile ranges. The whiskers range from max (lower quartile − 1.5 * IQR, smallest value) to min (upper quartile + 1.5 * IQR, largest value). Values outside of this range are marked by *.

