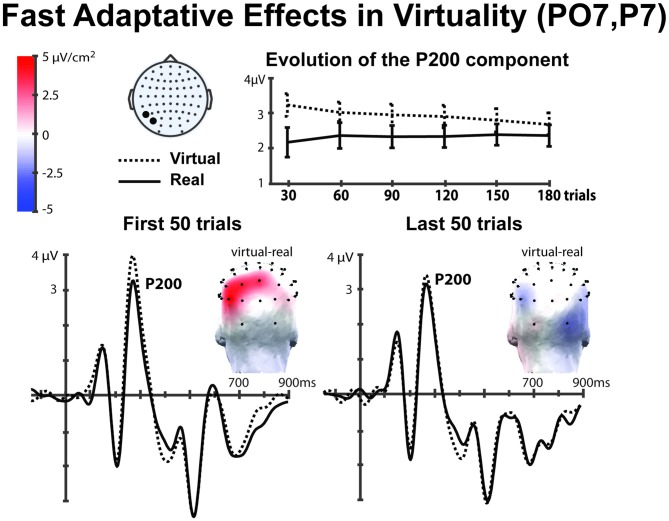
Figure 5.
The top panel shows the time evolution of the P200 amplitude in the left tempo-parietal cortex (P07, P7); presenting the cumulative voltage over blocks of 30 trials (the error bars show the standard error of the different participants ERPs). We observe how in the first trials the virtual and the real faces are processed as different objects; however, this effect is reduced after the overexposure. In the panel below we observe the grand averaged ERPs of the first and last 50 trials, and a clear reduction of the P200 component is also observed. The topographical plots show the CSD of the P200 component difference (avatar-real) in the scalp, we can see how the difference decreases over the last trials. A low pass filter (15 Hz, half-amplitude cut-off) was applied to these grand averaged graphs.

