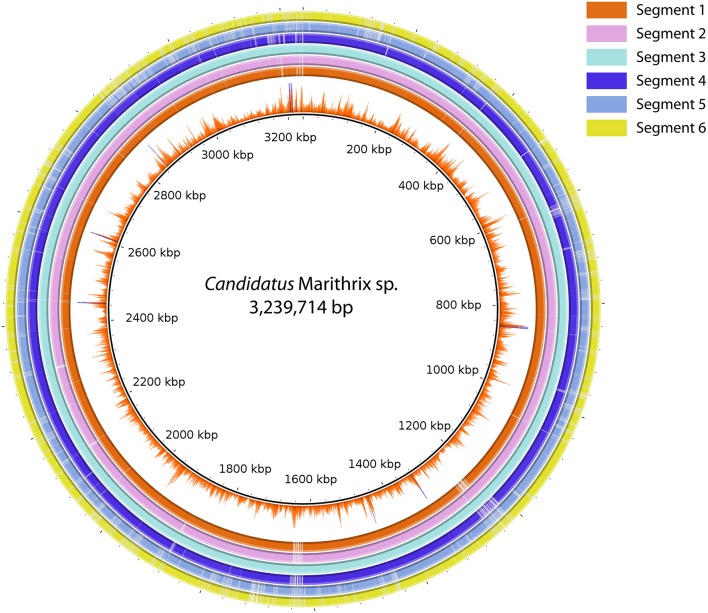
Figure 4.
Sequence comparison between all six segment datasets using BLASTN ring image generator. Segment 3 was used as reference due to the most successful assembly result. The inner-most ring represents the Illumina coverage of the segment 3 assembly. All regions in the figure represent at least 70% identity and an e-value ≤ 0.000001. The majority of sequence information is represented in all six datasets, and only segment 5 and 6 reveal larger regions with gaps, i.e., missing information in comparison to the other assemblies.

