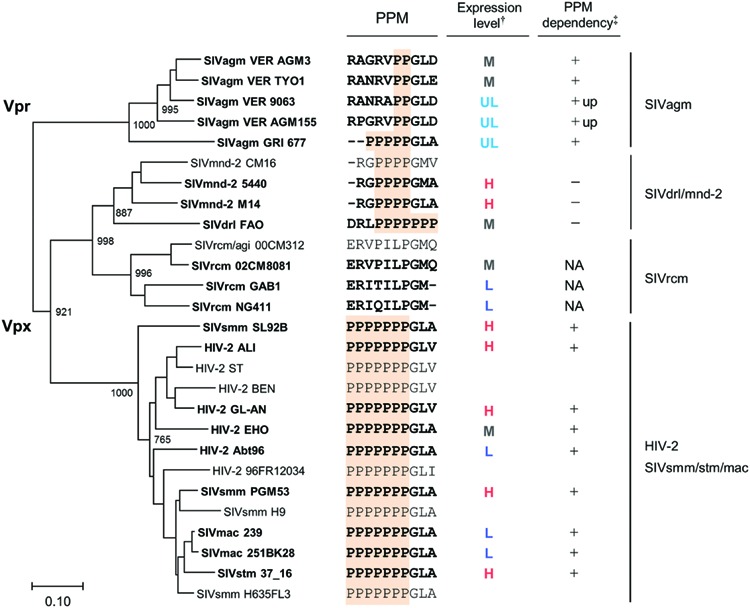
FIGURE 7.

Phylogeny and expression profiles of Vpx/Vpr proteins. Phylogenetic tree based on Vpx/Vpr proteins and their expression profiles in cells are shown in parallel (see Figure 1A for viral groups on the right). Scale bar represents the genetic distance. Branches were calculated from 1000 bootstrap replicates, and the bootstrap values are labeled on the major branches. Viral strains experimentally analyzed in this study (20 strains) are highlighted by boldface type letters. C-terminal regions of Vpx/Vpr proteins including PPM sequence (highlighted) and the summarized expression profiles (Figures 4–6) are shown in the middle. †: H, high; M, medium; L, low; UL, ultra-low (see Figure 5). ‡: +, decreased expression by PPM-deletion; +up, increased expression by PPM-deletion; -, no clear effect by PPM-deletion; NA, not applicable (no PPM).
