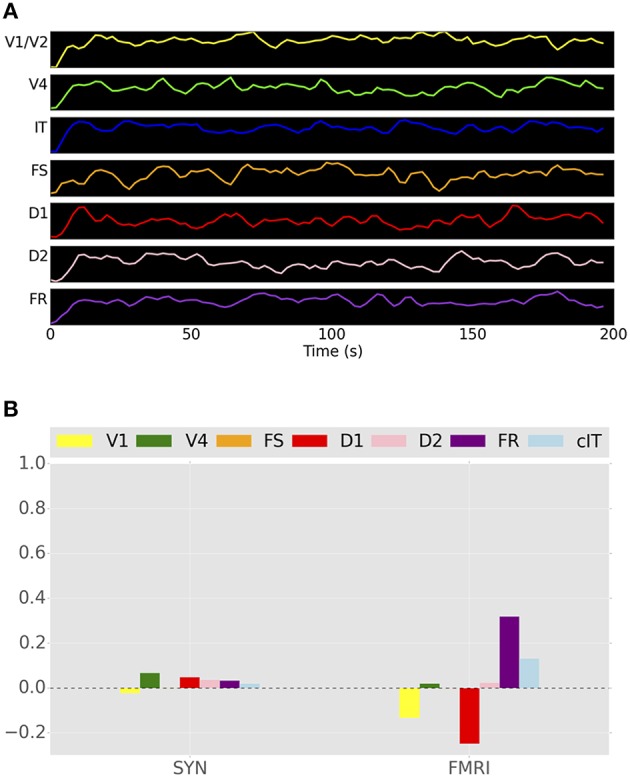
Figure 10.

(A) Simulated BOLD signal of the unmodified TVB Hagmann et al. (2008) brain model during visual stimulation in a single subject. One of the nodes in V1 was stimulated with a series of pulse trains that were similar in timing to the stimuli presented during the DMS task. (B) Functional connectivity between IT and all other ROIs in the network using both integrated synaptic activities and fMRI BOLD time-series.
