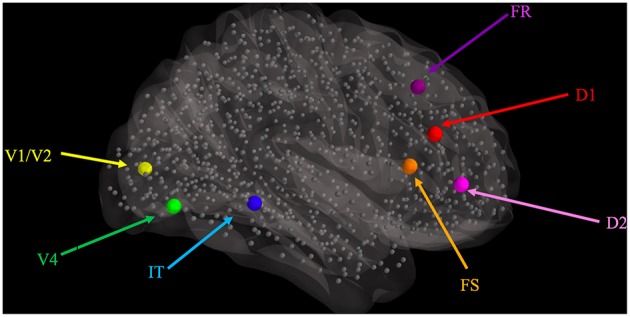
Figure 2.

Graphical representation of the locations where visual LSNM modules were embedded, relative to the location of the 998 nodes (smaller gray spheres) comprising the structural connectome of Hagmann et al. (2008), as represented in TVB. The larger spheres represent the location of the visual processing LSNM modules, as indicated with colored labels. Connections among LSNM modules and among nodes are not shown but were preserved upon embedding.
