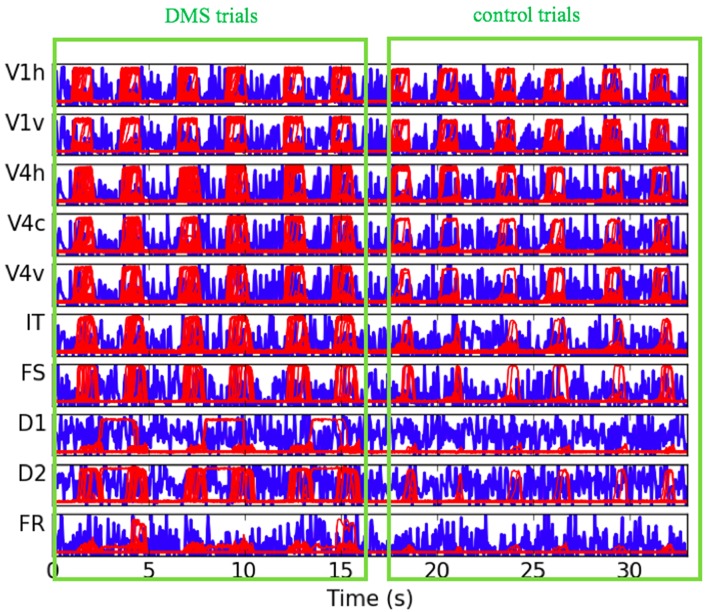
Figure 5.
Plots of electrical activity of all LSNM visual modules (red lines) and host nodes of Hagmann's connectome (blue lines), for a representative simulated subject. The simulated tasks were: three DMS trials (match, mismatch, match), followed by three control trials where degraded shapes were used as inputs and the attention parameter was set to low (passive viewing). The y axis of each of the plots represents level of electrical activity, between 0 and 1. V1h and V1v denote vertical and horizontal-selective neuronal populations within V1/V2. V4h, V4c, and V4v denote vertical, corner, and horizontal-selective neuronal populations within V4.

