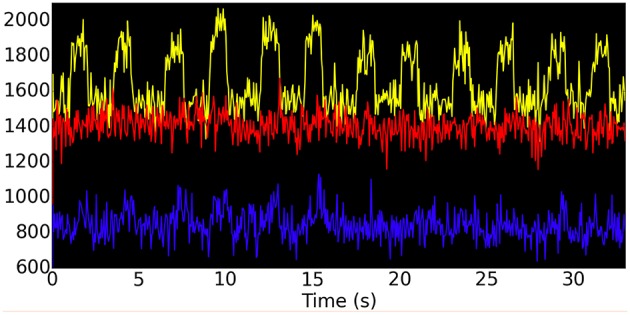
Figure 7.

Integrated synaptic activity using the ROIs for V1 (yellow), IT (blue), and D1 (red) shown in Figure 6 during a visual DMS experiment for a representative subject. Only the first six trials of the experiment are shown, corresponding to the electrical activities shown in Figure 5. The y-axis is in arbitrary units and the x-axis represents time in seconds.
