Figure 8.

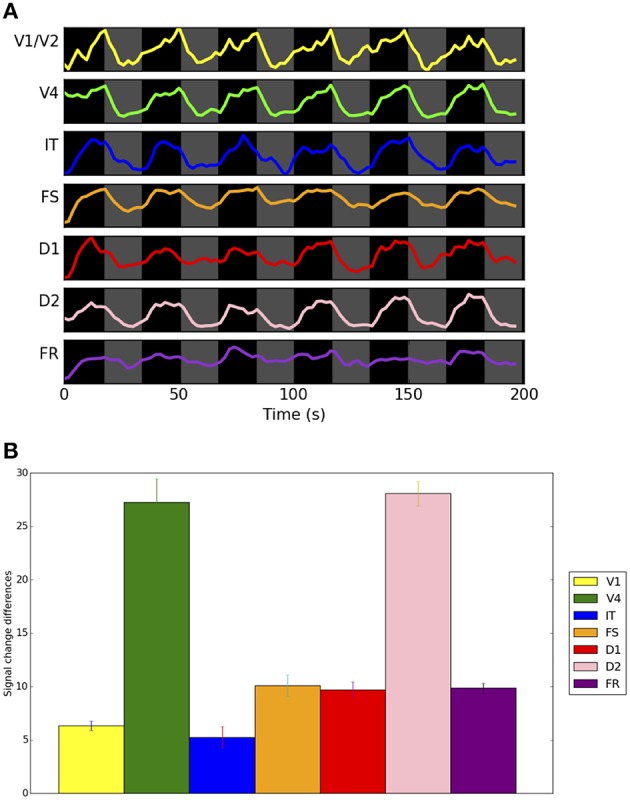
(A) Simulated fMRI BOLD signals, using the balloon hemodynamic response model, in combined LSNM/TVB modules, corresponding to the representative subject's integrated synaptic activity shown in Figure 7. Thirty-six trials were simulated, in groups of six task (DMS) trials (black areas) followed by six control (CTL) trials (gray areas). The x-axis represents time in seconds and the y-axis is in arbitrary units. The simulated TR is 2 s. (B) Bar graphs representing the mean signal change of timepoints 4, 5, and 6 after onset of a block of trials for each condition across 10 simulated subjects. In each ROI, the mean of the within-subject difference between the DMS and CTL conditions was statistically significant (see Table 3). Error bars indicate standard errors.
