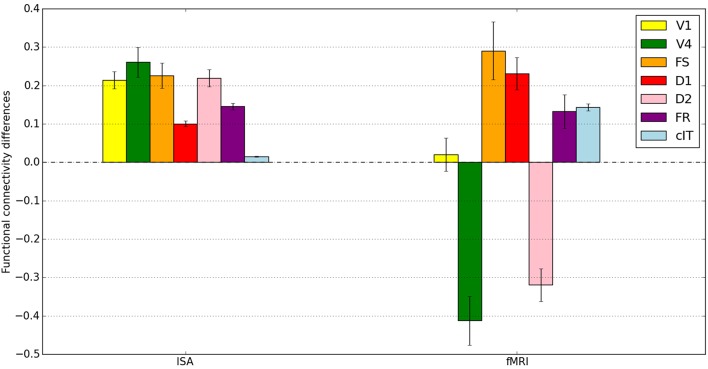
Figure 9.
Mean across subjects of the within-subject functional connectivity task differences between IT and all other brain modules. Shown on the left are the functional connectivity task differences for the integrated synaptic activity (ISA) and on the right for the fMRI BOLD time-series. The differences between DMS and CTL in the ISA time-series all reached statistical significance; all the differences (except for V1) between DMS and CTL in the fMRI time-series also were statistically significance (see Table 4 for more details). Error bars represent standard errors.

