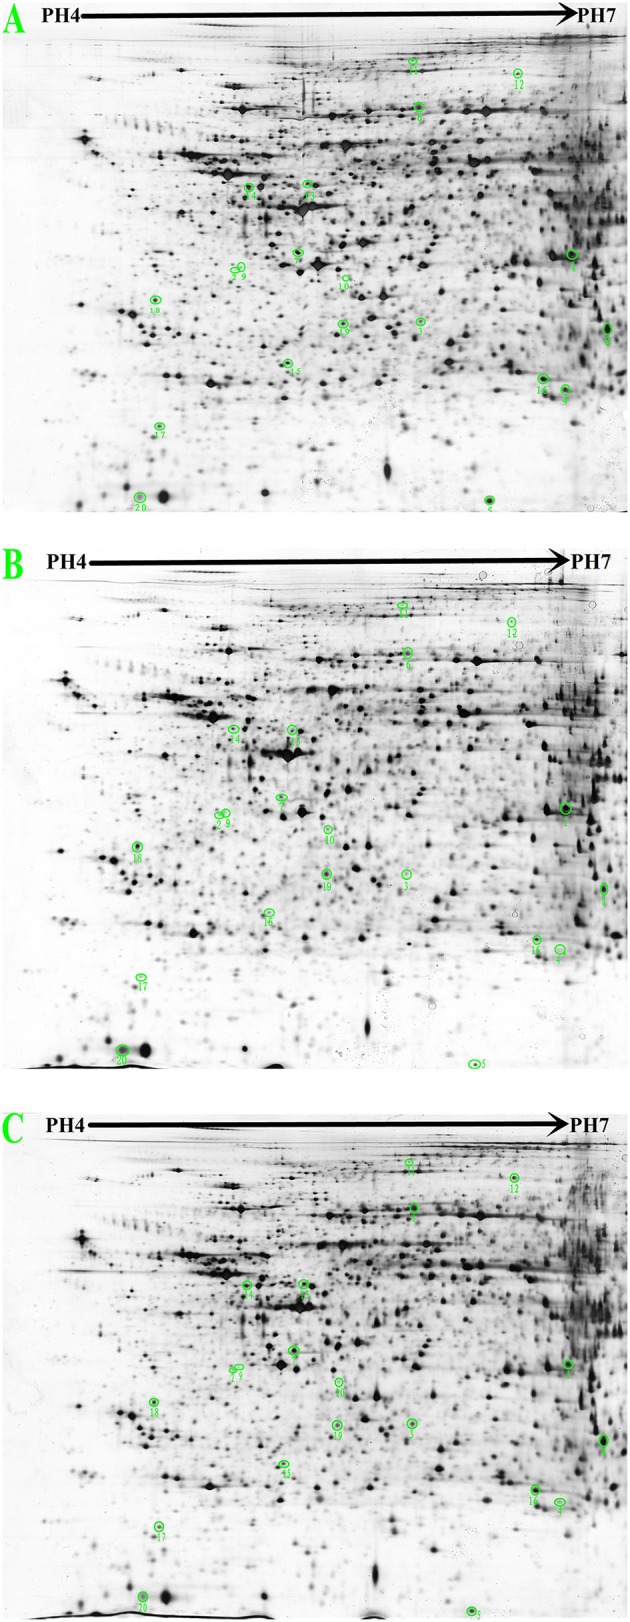
Figure 4.

2-DE images from rat liver protein extracts (proteins were separated in the first dimension at pH 4.0–7.0 and on a 12% SDS-PAGE gel in the second dimension. (A) Control group. (B) Hyperlipidemic group. (C) Grifola frondosa group).

2-DE images from rat liver protein extracts (proteins were separated in the first dimension at pH 4.0–7.0 and on a 12% SDS-PAGE gel in the second dimension. (A) Control group. (B) Hyperlipidemic group. (C) Grifola frondosa group).