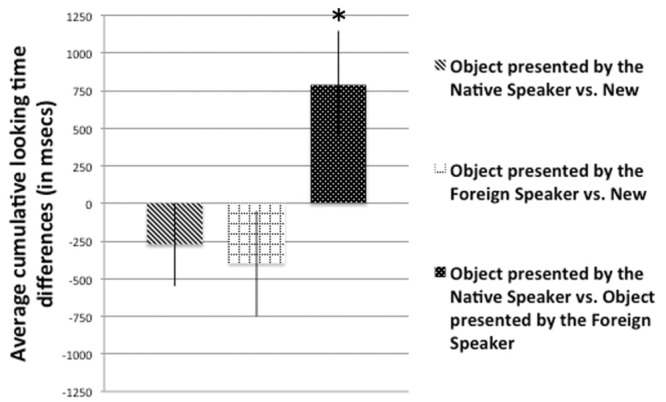
FIGURE 3.

Average looking time differences in the Test Phase in Experiment 2. Bars represent the average looking time differences of 40 infants in the three types of test trials. Error bars indicate SEM. Asterisks show significant differences from chance level.
