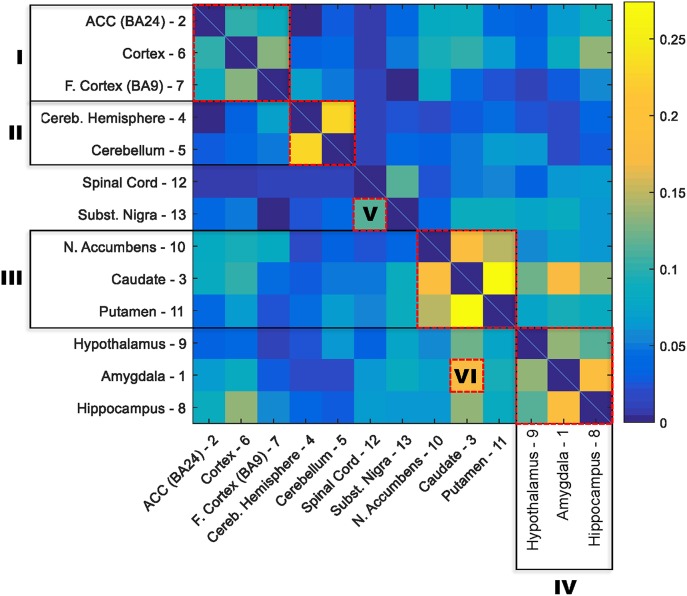
Figure 1.
Correlation matrix for the responsiveness of genes to aging between 13 GTEx brain regions. The responsiveness to aging of a gene was measured with the P-value for slope coefficient in the linear regression model between age and gene expression. The correlation between each two brain regions was estimated with the nonparametric Spearman rank correlation coefficient between P-values of all genes in the two regions. The order of regions in the matrix was rearranged based on the similarity between regions. Six clusters of highly correlated regions are highlighted with red boxes: I, cortex; II, cerebellum; III, basal ganglia; IV, hypothalamus, amygdala, and hippocampus; V, substantia nigra and spinal cord; and IV, amygdala and caudate.

