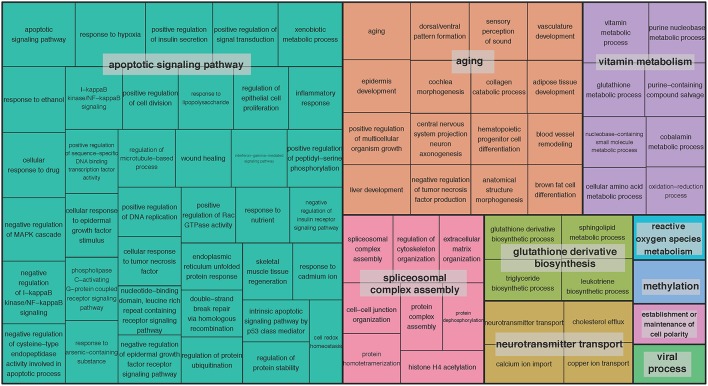
Figure 2.
TreeMap view of GO-term clusters for age-related genes in the brain. The TreeMap was generated by using REVIGO with the input of all GO BP terms of age-related genes detected in 13 GTEx brain regions at the FDR of 5%. Each rectangle represents a single GO-term cluster. The size of the rectangles is proportional to the frequency of the GO term in the associated GO annotation database. The cluster representatives were joined into “superclusters” of loosely related terms, visualized with different colors.

