Figure 4.
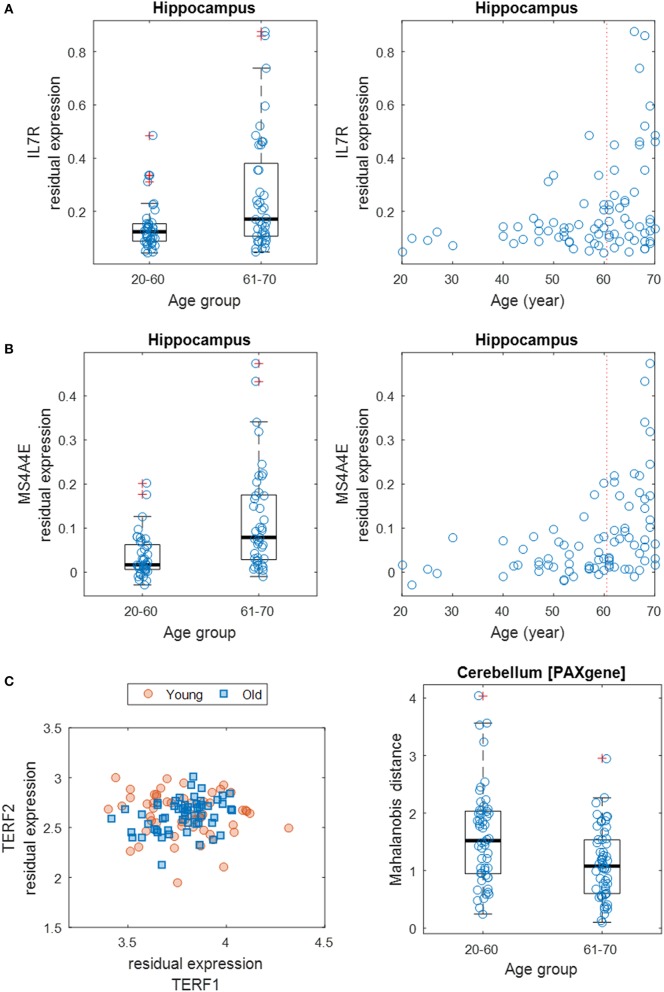
Differential gene expression dispersion between age groups. (A) Increased gene expression variance of IL7R in hippocampus between age groups (left: 20–60 years vs. 61–70 years; right: all ages). Each age group was plotted with jitter along the x-axis to show samples within each genotype. (B) Same as (A) but for MS4A4E. (C) Scatter plot (left) of expression levels of TERF1 and TERF2 with data points grouped by young (20–59 years) and old (60–70 years) ages. Boxplot (right) of MDs of young and old samples' TERF1 and TERF2 expression profiles to the population center.

