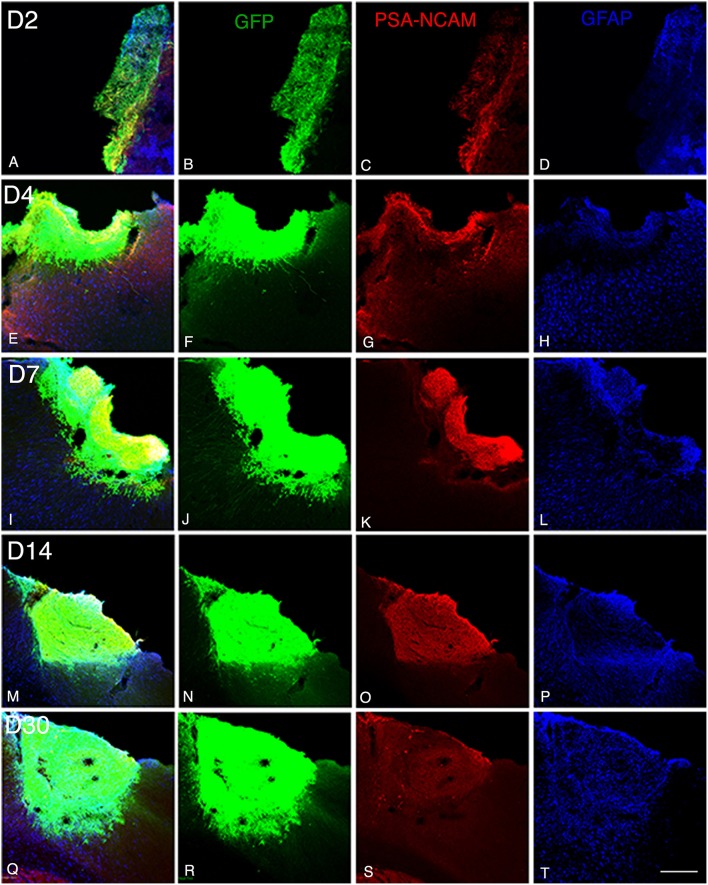
Figure 1.
Graft and graft-derived axonal projections at different time points following transplantation. (A–T) Confocal images of GFP (green), PSA-NCAM (red), GFAP (blue) labeling from day 2 (D2) to day 30 (D30) after transplantation. (A–P) Grafts were composed of immature neural cell types as revealed by immunochemistry for GFP and PSA-NCAM. (Q–S) Grafted cells no longer expressed PSA-NCAM at day 30. (A,D,E,H,I,L,M,P,Q,T) Immunohistochemistry for the glial marker (GFAP) showed that the grafts also contained differentiated astrocytes. Note that not many GFAP expressing astrocytes were present at the host-graft interface. Scale bar: 130 μm.

