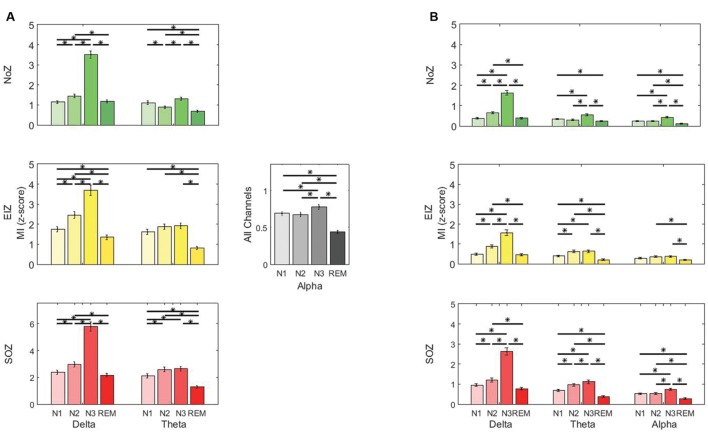
FIGURE 3.
Average phase-amplitude coupling (PAC) quantified by modulation index (MI) (A) gamma band and low frequencies, (B) ripple band and low frequencies. Green: normal zone (NoZ), Yellow: exclusively irritative zone (EIZ), Red: seizure onset zone (SOZ), Gray: all channels. ∗ Shows significant difference (p < 0.05, corrected). The order: N1, N2, N3, REM, from light to dark color. Results are plotted as the mean ± SE.

