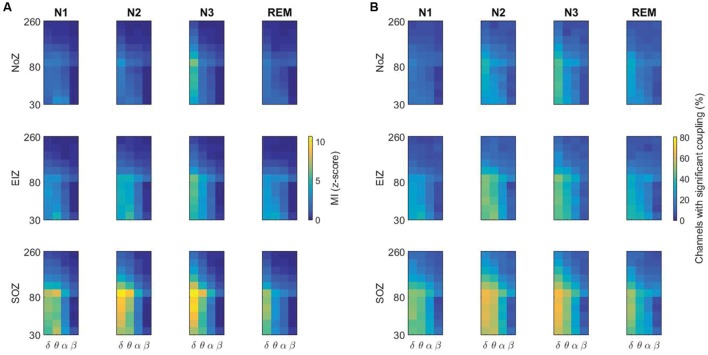
FIGURE 5.
(A) Higher values of PAC in the SOZ compared to the NoZ, and in N3 compared to other stages. The average of PAC in all channels in different sleep stages, (B) Percentage of channels with significant coupling in different frequency pairs. NoZ, normal zone; EIZ, exclusively irritative zone; SOZ, seizure onset zone; MI, modulation index.

